
Figures & data
Table 1. Longitudinal data (n = 15)Table Footnotea.
Figure 1. Changes over time. The different panels illustrate longitudinal time course changes in (A) interleukin-6 (IL-6), (B) S-hepcidin, (C) transferrin, (D) S-ferritin, and (E) soluble transferrin receptor (sTfR) throughout pregnancy. Bars show median values and whiskers show the 95% confidence interval (CI). The dotted horizontal lines in panel D indicate the cutoff for exhausted iron stores based on S-ferritin (12 µg/L) and the dotted horizontal lines in panel E indicate the lower concentration of the transferrin receptor (TfR) reference interval (4.4 mg/L). sTfR: soluble transferrin receptor; IL-6: interleukin-6; CB: cord blood; T3: trimester 3.
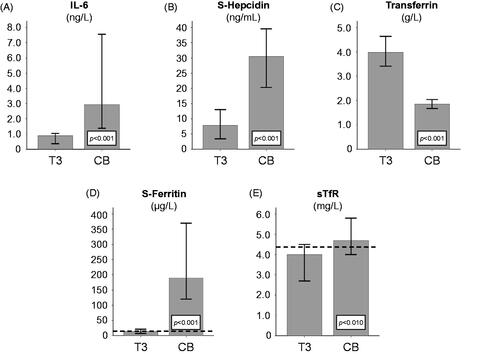
Figure 2. Correlations during trimester 3 of pregnancy. The different panels illustrate the correlation coefficients for (A) log soluble transferrin receptor (sTfR) versus log S-ferritin; (B) log transferrin versus log S-ferritin; (C) log IL-6 versus log S-hepcidin; (D) log sTfR versus log S-hepcidin; and (E) log S-ferritin versus log S-hepcidin.
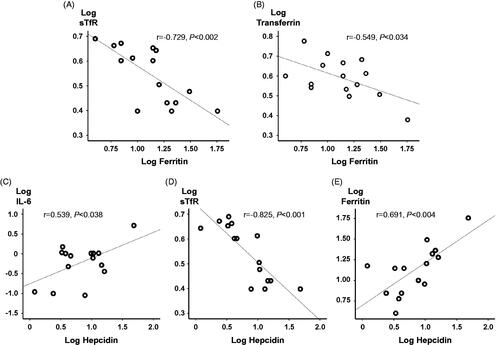
Table 2. Correlations in biomarkers sampled in trimester 3 and in cord blood. Pearson correlations with p values.