
Figures & data
Figure 1. Flow chart showing selection of study participants.
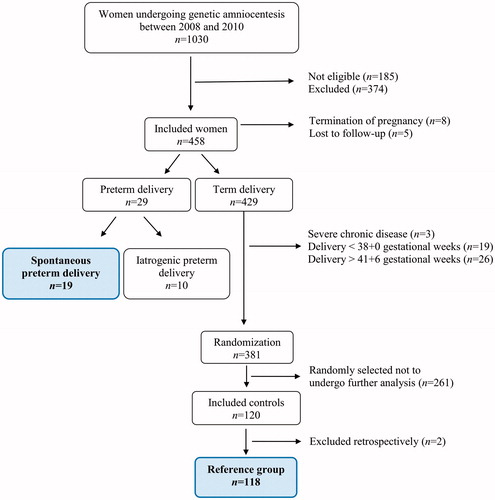
Table 1. Maternal and neonatal characteristics in the spontaneous preterm delivery and term delivery groups.
Figure 2. Heat map demonstrating the correlation (r) between the log concentrations of the examined candidate proteins. Candidate proteins in bold and italics indicate nominal significance.
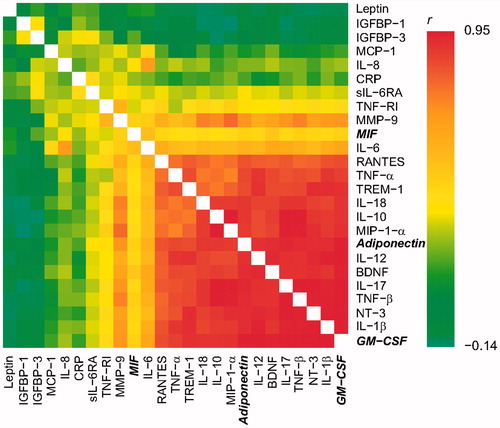
Table 2. Number of samples of each of the selected candidate proteins in the mid-trimester amniotic fluid that were below the lowest, respectively, exceeded the highest concentrations in the working range.
Table 3. Amniotic fluid levels of selected candidate proteins in relation to spontaneous preterm and term delivery.