
Figures & data
Figure 1. Source of patient population.
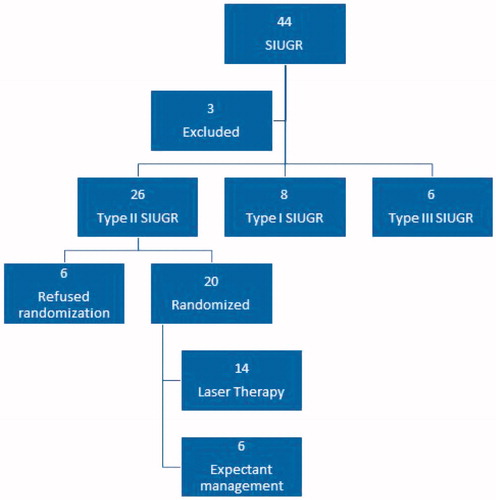
Table 1. Antenatal demographics.
Table 2. Indication for delivery.
Table 3. Perinatal outcome.
Table 4. Gross neurological outcome.
Figure 2. Motor developmental quotient in the IUGR children. There was a tendency for lower scores in the expectantly managed group (p=.062). IUGR: growth restricted twin.
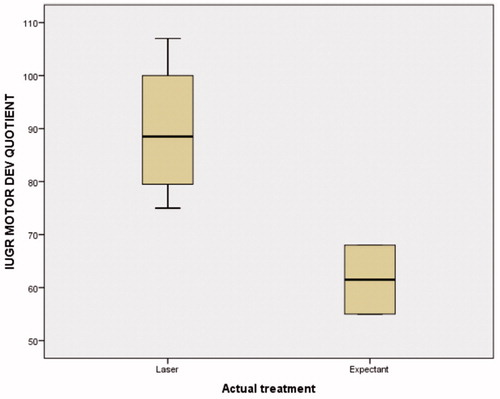
Table 5. Neurodevelopmental outcomes: AGA baby.
Table 6. Neurodevelopmental outcomes: IUGR baby.
Table 7. Total developmental quotient AGA versus IUGR in paired children.