
Figures & data
Figure 1. Flowchart of the study data.
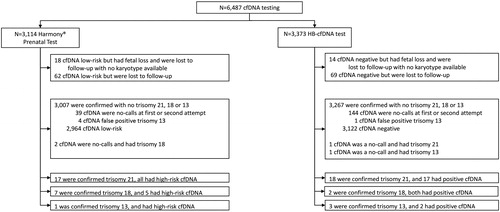
Table 1. Summary of study population characteristics.
Table 2. Women’s characteristics and cell-free DNA testing failure rates obtained before and after matching of populations from both laboratories, using the propensity score.
Table 3. Performance of the cfDNA test in the two different laboratories.
Table 4. Details of the all cases with rare incidental findings on NIPT in this study.