
Figures & data
Table 1. Distribution of maternal demographic characteristics of Medicaid covered pregnancies overall and by SMM status in Arkansas, 2013–2016, and marginal SMM rate for each category of the variables.
Figure 1. SMM rate (95% CI) per 10,000 Medicaid covered pregnancies by the Bateman score cluster of ANGELS data 2013–2016, total N = 72,111.
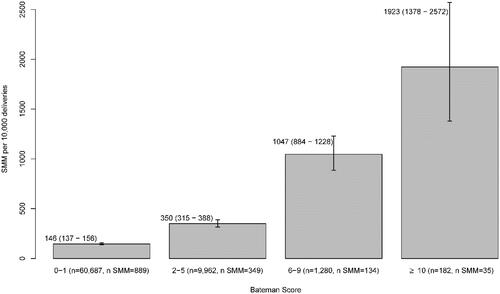
Table 2. Adjusted effects of the Bateman index score and maternal demographic characteristics on the risk of SMM among Medicaid covered pregnancies in Arkansas, 2013–2016.
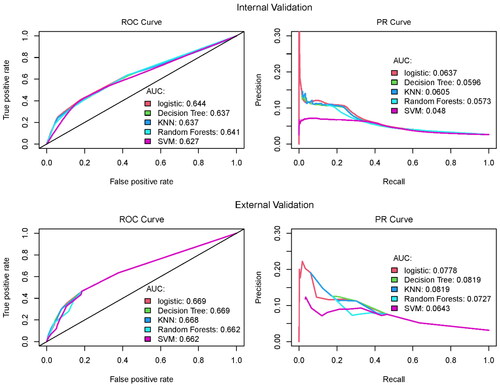
Figure 2. Predictive performance evaluations of the applied modeling approaches by both internal and external validation procedures using ANGELS data 2013–2016.
Supplemental material