Figures & data
Figure 1. Protein c levels in adults compared with term neonatal and preterm infants. (A) protein c activity was measured in adult controls (adult con; n = 9), term neonatal controls (neo con; n = 10) and preterm infants (n = 26). ***p < .0001 using one-way ANOVA. Whole blood was incubated with LPS in the absence or presence of APC for 1 h. Neutrophils and monocytes were stained with mAb anti-CD11b and mean channel fluorescence (MFI) was measured by flow cytometry. The neutrophil and monocyte populations were selected based on their scatter profile: forward scatter and sideway scatter. (B and C) graphs show MFI ± SEM of neutrophil (B) and monocyte (C) CD11b in blood from adult and neonatal controls and preterm infants. ***p < .0001 using one-way ANOVA comparing between LPS stimulated and unstimulated. ###p < .0001 using one-way ANOVA to compared NE unstimulated and adult and neonatal controls.
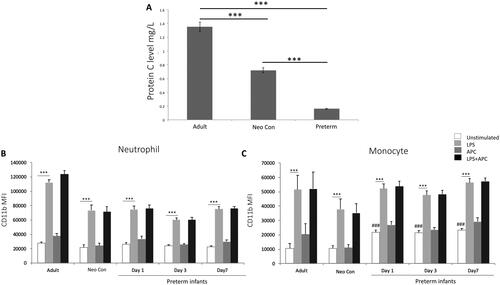
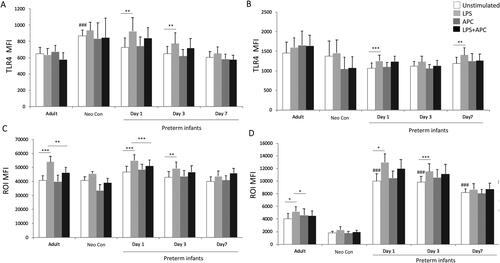
Figure 2. Neutrophil and Monocyte TLR4 and ROI response to LPS and APC modulation in preterm infants. Whole blood was incubated with LPS in the absence or presence of APC for 1 h. Cells were then stained with mAb anti-TLR4, or stimulated with DHR and PMA. TLR4 and ROI were analyzed by flow cytometry, and results expressed in MFI ± SEM. The neutrophil and monocyte populations were selected via flow cytometry based on their scatter profile. (A and B) graphs show MFI ± SEM of neutrophil (A) and monocyte (B) TLR4. (C and D) graphs show MFI ± SEM of neutrophil (C) ROI and monocyte (D) ROI. *p < .05, **p < .01, **p < .001, ***p < .0001 using one-way ANOVA comparing between LPS stimulated and unstimulated. ###p < .0001 using one-way ANOVA comparing NE unstimulated and adult and neonatal controls.