
Figures & data
Table 1. Baseline and obstetrical characteristics, maternal and neonatal outcomes of the study population.
Figure 1 Population study according to the consistency of mode of delivery with ESC Guidelines
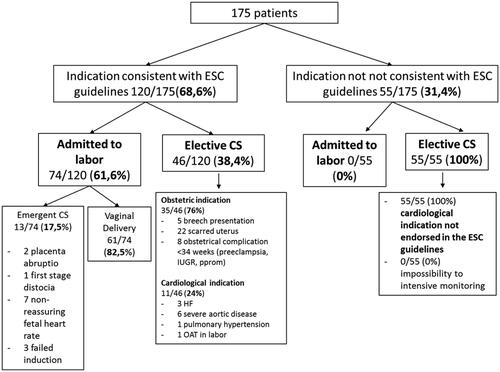
Table 2. Primary analysis: univariable comparison between “ESC consistent” and “ESC not consistent.”
Table 3. Multivariatble analysis for neonatal composite adverse outcome (CAN).