
Figures & data
Figure 1. Diagram illustrating the process of searching databases and identifying studies.
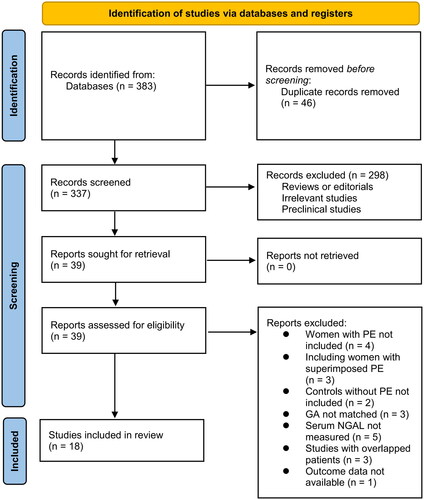
Table 1. Characteristics of the included studies.
Table 2. Study quality evaluation via the Newcastle-Ottawa Scale.
Figure 2. Forest plots comparing the circulating level of NGAL between women with and without PE.
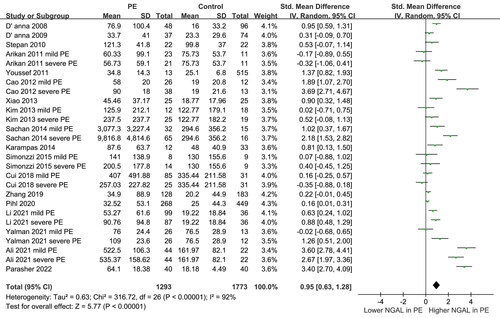
Figure 3. Forest plots for the subgroup analyses according to the timing of blood sampling.
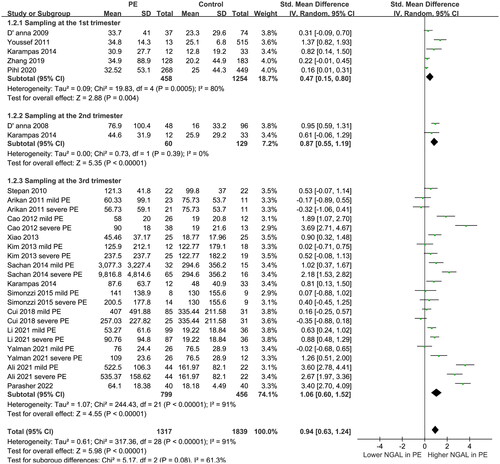
Figure 4. Forest plots for the subgroup analyses for comparisons of mild or severe PE versus control.
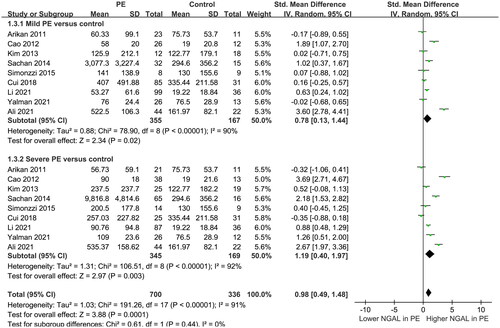
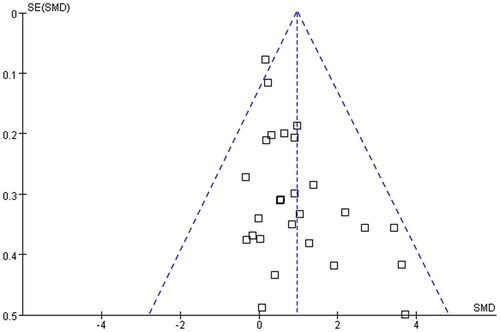
Figure 5. An analysis of the publication bias of the meta-analyses based on funnel plots.
Data availability statement
The data used to support the findings of this study are included within the article.