
Figures & data
Figure 1. PRISMA flow diagram. *Consider, if feasible to do so, reporting the number of records identified from each database or register searched (rather than the total number across all databases/registers). **If automation tools were used, indicate how many records were excluded by a human and how many were excluded by automation tools.
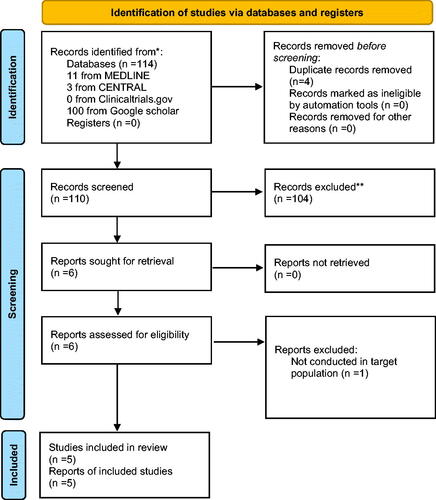
Table 1. Study characteristics of the included studies.
Table 2. Patient characteristics of the included studies.
Figure 2. Forest plot of the overall outcome and all subgroups.
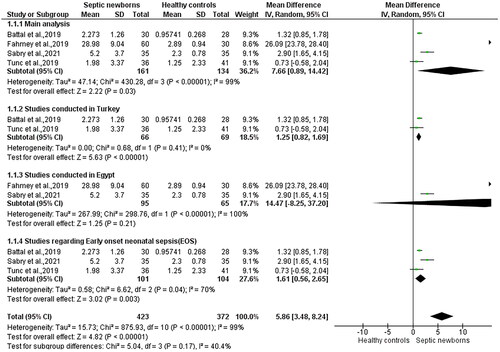
Table 3. Leave-one-out meta-analysis.
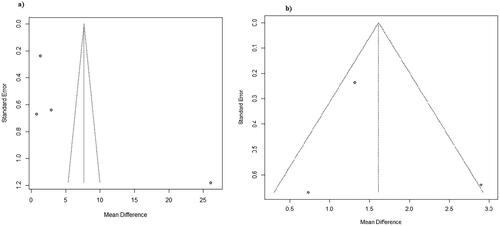
Figure 3. Funnel plot: (a) overall outcome, (b) early onset neonatal sepsis subgroup.
Supplemental material