
Figures & data
Figure 1. The transvaginal probe with the force-measuring device mounted on the probe handle.
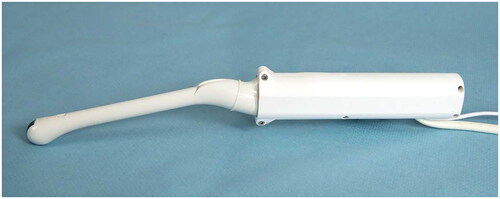
Figure 2. Left, B-mode image with the elastography color box superimposed on a cervix at gestational week 38. The ROI (yellow) is placed within the anatomical area of interest within the middle third of the anterior cervical lip. The probe-centerline is marked with the white dashed line. Right, in the resulting strain curve calculated by the GE-software, the strain peak height (Sδ) is marked.
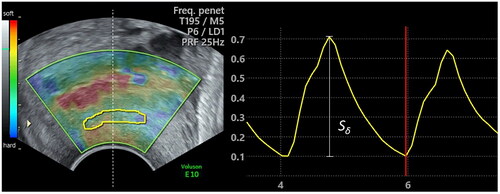
Figure 3. The force data plotted against the time with the area of a force peak (AF), marked with green.
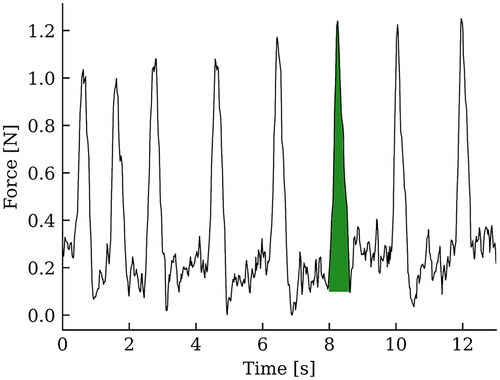
Table 1. Background characteristics, women with different gestational ages.
Table 2. Cervical length, CEIGE and CSIGE in relation to the gestational age where cervical elastography indexGE (CEIGE) and cervical strength indexGE (CSIGE), gestational age (GA), number of pregnant women (n).
Table 3. Background characteristics, women admitted for labor induction.
Figure 4. Receiver operating characteristic (ROC) curves showing the cervical elastography indexGE (triangle) as predictor of cervical dilatation time >7 h for (A) all included women, (n = 27), and (B) nullipara (n = 19). CO (0.13) indicates the cut off giving the maximum Youden value (enlarged black triangle) [Citation30]. (C) Cervical dilatation time from 4 to 10 cm (hours) in relation to the cervical elastography indexGE for nullipara.
![Figure 4. Receiver operating characteristic (ROC) curves showing the cervical elastography indexGE (triangle) as predictor of cervical dilatation time >7 h for (A) all included women, (n = 27), and (B) nullipara (n = 19). CO (0.13) indicates the cut off giving the maximum Youden value (enlarged black triangle) [Citation30]. (C) Cervical dilatation time from 4 to 10 cm (hours) in relation to the cervical elastography indexGE for nullipara.](/cms/asset/aade988c-0024-499f-823f-2b8b70382d9a/ijmf_a_2213797_f0004_c.jpg)
Table 4. Among women undergoing induction of labor, the associations between cervical length, CEIGE and Bishop Score and the outcomes durations of latency phase and active phase are expressed by the area under the ROC curve (AUC) with 95% CI.