
Figures & data
Figure 1. PRISMA 2020 flow diagram of selection process for included studies.
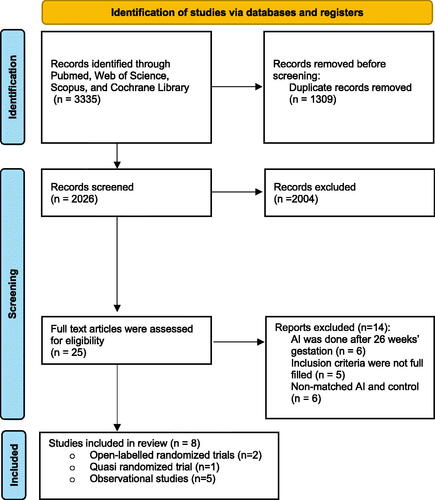
Figure 2. Effects of amnioinfusion on neonatal outcomes for observational studies. Forest plot of the results of the meta-analysis of observational studies for (A) latency period length, which displays the difference in latency period lengths between the amnioinfusion and standard management groups; (B) perinatal mortality rates refer to the risk ratio.
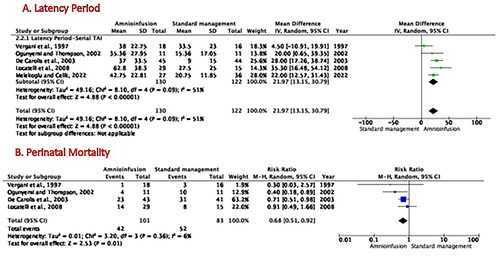
Table 1. The effects of intervention on the secondary outcomes.
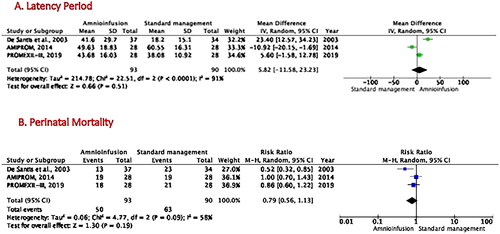
Figure 3. Effects of amnioinfusion on neonatal outcomes for randomized controlled trials. Forest plot of the results of the meta-analysis of randomized control trials for (A) latency period length, which displays the difference in latency period lengths between the amnioinfusion and standard management groups; (B) perinatal mortality rates refer to the risk ratio.
Supplemental Material
Download Zip (118.8 KB)Data availability statement
All data generated or analyzed during this study are included in this article and its supplementary material files. Further enquiries can be directed to the corresponding author.