
Figures & data
Figure 1. Selection flowchart.
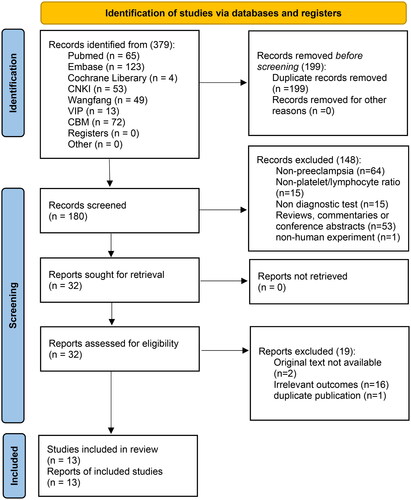
Table 1. The basic characteristics of the included thirteen studies in the systematic review.
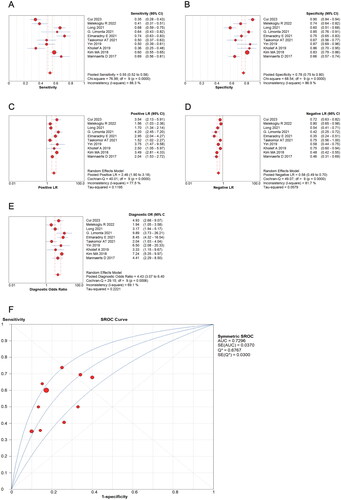
Figure 2. Forest plots of diagnostic Performance of PLR for PE in second and third trimesters. (A) sensitivity, (B) specificity, (C) negative likelihood ratio, (D) positive likelihood ratio, (E) diagnostic odds ratio (DOR), (F) area under the summary receiver operating characteristic (SROC) curve. The first author’s name and year of each studies are listed. CI: confidence interval.
Supplemental material