
Figures & data
Table 1. Baseline characteristics of the study participants.
Table 2. PIPP scores before, during, and after PICC insertion.
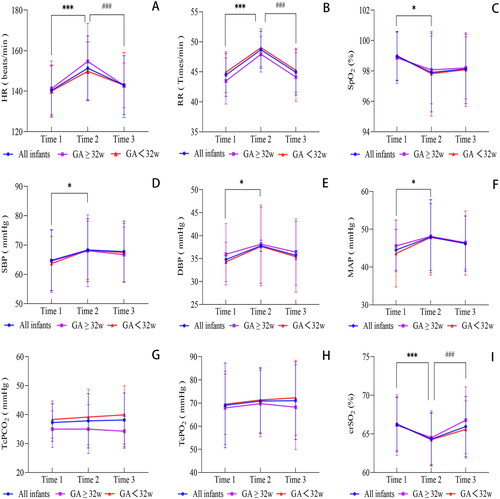
Figure 1. Vital parameters before, during, and after PICC insertion.
***P < .001 between time 1 and time 2 in the three groups, respectively; ###P < .001 between time 2 and time 3 in the three groups, respectively; *P < .05 between time 1 and time 2 in all infants group and gestational age < 32 weeks group.
Data availability statement
The data used in this study are available from the corresponding author upon reasonable request.