
Figures & data
Figure 1. Flowchart of PPH evaluation and management. CT: computed tomography; ICU, intensive care unit; PPH, postpartum hemorrhage; TAE, transarterial embolization
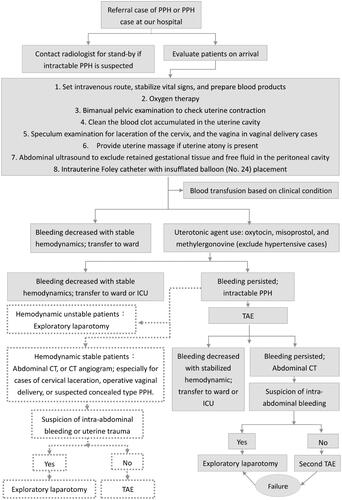
Figure 2. Maternal clinical characteristics and labor course (N = 6)
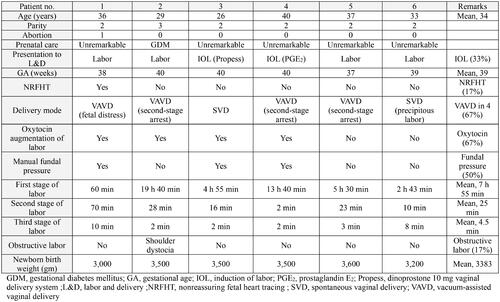
Table 1. Possible contributing factors to uterine rupture in our study population (N = 6)
Figure 3. Abdominal computed tomography images and intraoperative findings in our study (N = 6). Each case is dipicted in panel A to F. A: Contrast extravasation (white arrow), and myometrium disruption with intraperitoneal hematoma formation (yellow arrow) observed on contrast-enhanced abdominal computed tomography. This corresponds to the location of uterine rupture site (black arrowhead). B : Abdominal computed tomography following trans-arterial embolization displaying myometrium disruption with intraperitoneal hematoma formation (yellow arrow) consistent with the uterine rupture site (black arrowhead). C : Contrast-enhanced abdominal computed tomography following trans-arterial embolization, revealing myometrium disruption with concealed subserosal hematoma formation (yellow arrow) leading to engorgement of the lower uterine segment. D: Abdominal computed tomography after failure of attempted trans-arterial embolization, demostrating myometrial disruption and intraperitoneal hematoma (yellow arrow) in line with the uterine rupture site. Also indicating direct uterine vessel injury after operative vaginal delivery (black arrowhead). E: Contrast extravasation (white arrow), and myometrial disruption with intraperitoneal hematoma formation (yellow arrow) on contrast-enhanced abdominal computed tomography, corresponding to the uterine rupture site (black arrowhead). (L, left; R, right)
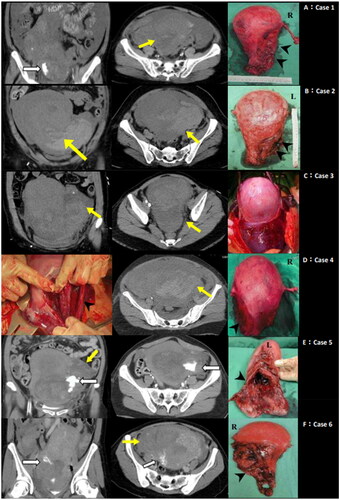
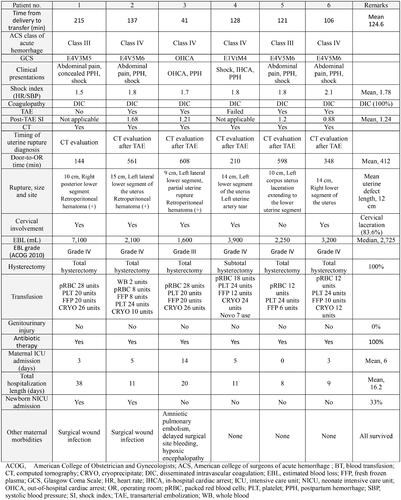
Table 2. Site of uterine rupture among patients with unscarred uterus in our study (N = 6)
Figure 4. Clinical maternal presentations and outcome, and perinatal morbidities (N = 6)
Data availability statement
The data that support the findings of this study are available from the corresponding author, F.T.K, upon reasonable request.All data generated or analysed during this study are included in this published article.