
Figures & data
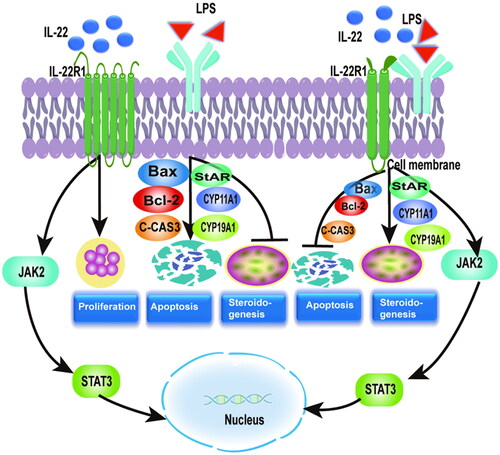
Table 1. Clinical and biochemical characteristics of PCOS and control women.
Figure 1. Patients with PCOS had lower levels of IL-22 in their follicular fluid, and IL-22R1 protein localization was detected in ovarian GCs. (a) IL-22 protein expression in follicular fluid of the control (n = 15) and PCOS (n = 15) groups as determined via ELISA assay. *p < 0.05. (b) RT-PCR findings demonstrating IL-22R1 mRNA expression in human GCs (n = 3). (c) Immunofluorescence staining indicating the location of IL-22R1 in KGN cells. The positive expression of IL-22R1 in cell membranes is represented by green fluorescence, and the DAPI-labelled nuclei in blue indicate that IL-22R1 is localized in the cell membrane of human ovarian GCs. Scale bar: 100 μm.
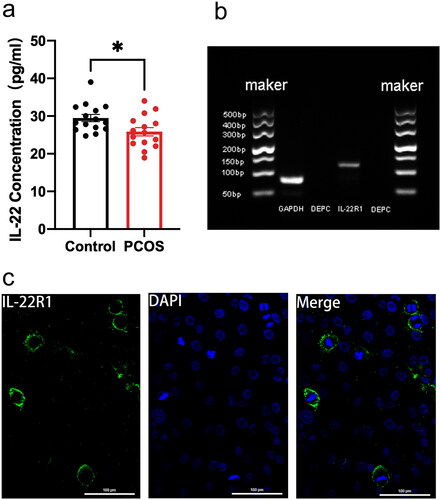
Figure 2. IL-22 promoted proliferation in KGN cells and reversed the inhibitary effect of LPS. There were four treatment groups for cells: Control; LPS treated; rhIL-22 treated; LPS and rhIL-22 treated. (a) Graph showing the viability of KGN cells treated with different concentrations (0, 1, 2, 5, and 10 ng/mL) of IL-22 measured using CCK8 assay at different time points (3, 6, 12, and 24 h). ****p < 0.0001. (b) Representative images showing the proportion of proliferating KGN cells treated with LPS and/or IL-22 in the EdU assay. Cell nuclei were detected by Hoechst staining (blue) and proliferating cells by EdU staining (red). the results were analyzed using ImageJ. Scale bar: 50 μm. (c) Statistical graph showing the proportion of EdU-positive cells. Values are expressed as the mean ± SEM, n = 3. All experiments were performed in triplicate. *p < 0.05, **p < 0.01.
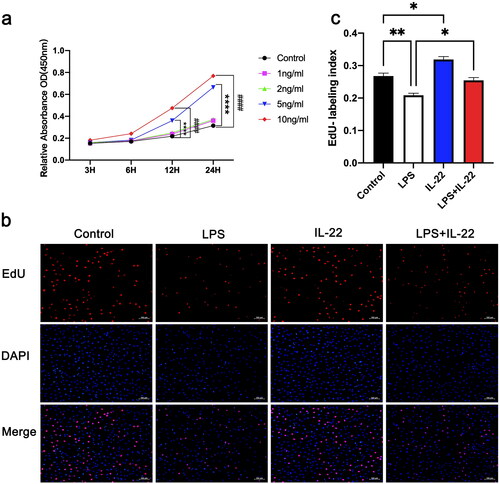
Figure 3. IL-22 reversed the pro-apoptotic role of LPS in KGN cells. There were four treatment groups for cells: Control; LPS treated; rhIL-22 treated; LPS and rhIL-22 treated. (a) Representative images of flow cytometry in each group. (b) Graph showing statistical analysis using flow cytometry (). Values are expressed as the mean ± SEM, n = 3. * p < 0.05, *** p < 0.001. (c) The expression levels of apoptosis-related proteins Bax, Bcl-2, caspase-3 and cleaved caspase-3 were evaluated by western blotting in the different groups. (d–f) Graph showing statistical analysis of western blotting (). Values are expressed as the mean ± SEM, n = 3. *p < 0.05, **p < 0.01, ns: nonsignificant. All experiments were performed in triplicate. Values are expressed as the mean ± SEM, n = 3.
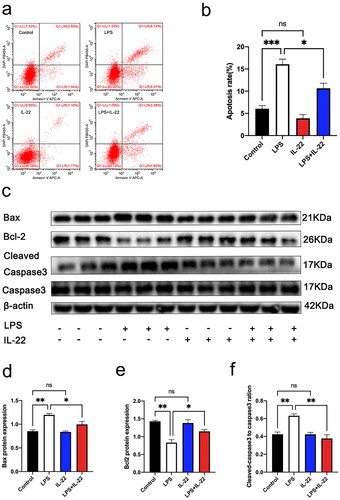
Figure 4. IL-22 reversed LPS-mediated inhibition of steroidogenic genes in KGN cells. There were four treatment groups for cells: Control; LPS treated; rhIL-22 treated; LPS and rhIL-22 treated. (a) The expression levels of steroidogenesis-related proteins StAR, CYP11A1, and CYP19A1 were assessed by western blotting in the different groups. (b–d) Graph showing the statistical analysis of western blotting results in . Values are expressed as the mean ± SEM, n = 3. *p < 0.05, **p < 0.01 ***p < 0.001, ****p < 0.0001 ns: nonsignificant. All experiments were performed in triplicate.
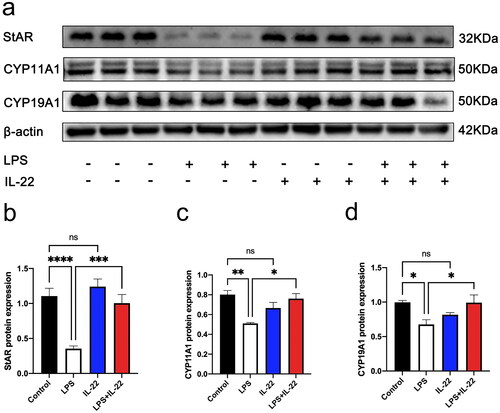
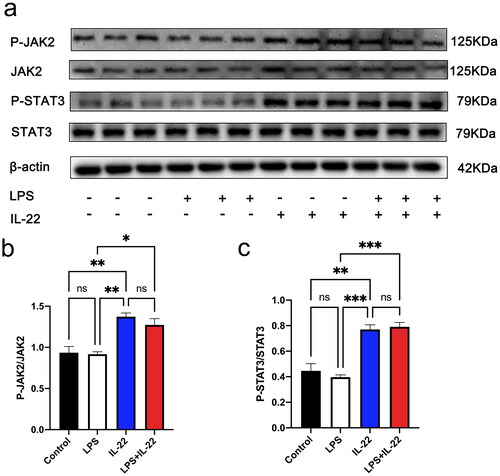
Figure 5. IL-22 activated p-JAK2 and p-STAT3 in KGN cells. There were four treatment groups for cells: Control; LPS treated; rhIL-22 treated; LPS and rhIL-22 treated. (a) The expression levels of p-JAK2/JAK2 and p-STAT3/STAT3 were assessed by western blotting in the different groups. (b-c) Graph showing the statistical analysis of western blotting for p-JAK2/JAK2 and p-STAT3/STAT3, respectively. Values are expressed as the mean ± SEM, n = 3. *p < 0.05, **p < 0.01 ***p < 0.001 ns: nonsignificant. All experiments were performed in triplicate.
Data availability
Data availability on request from the corresponding author.