
Figures & data
Table 1. Demographic characteristics of the GDM and control groups.
Table 2. Comparison of GDM and control groups in terms of laboratory findings.
Table 3. Comparison of GDM and control groups in terms of perinatal outcomes.
Table 4. Comparison of GDM and control groups in terms of the gestational week at blood sampling and maternal serum endocan concentrations.
Table 5. Comparison of the control group with normal weight, control group with overweight, GDM group with normal weight, and GDM group with overweight in terms of BMI, gestational week at blood sampling, and maternal serum endocan concentrations.
Figure 1. Maternal serum endocan concentrations of the control and the GDM groups.
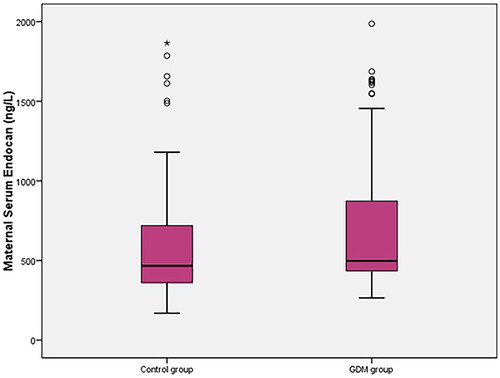
Figure 2. Maternal serum endocan concentrations of the control group with normal weight, the control group with overweight, the GDM group with normal weight, and the GDM group with overweight.
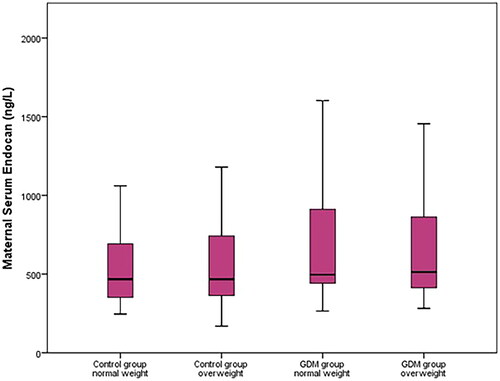
Table 6. Correlation between maternal serum endocan concentrations and GDM-related parameters.
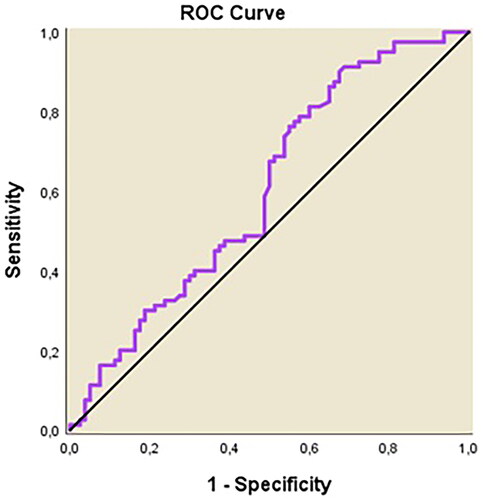
Figure 3. ROC analysis for sensitivity, specificity, and positive and negative predictive value of maternal serum endocan in GDM.
Data availability statement
Data supporting the findings of this study is available via the OSFHOME data repository with the 10.17605/OSF.IO/QBPE2 DOI identifier.