
Figures & data
Table 1. Maternal demographics.
Figure 1. (A, B) Normal pregnancies and (C, D) pregnancies with a history of COVID-19 disease. (A, C) Diagrams of placental area designation. (B, D) Changes in ΔR2* values with maternal oxygen administration. Maternal oxygen is administered between 240 and 480 s, indicating increased ΔR2* values.
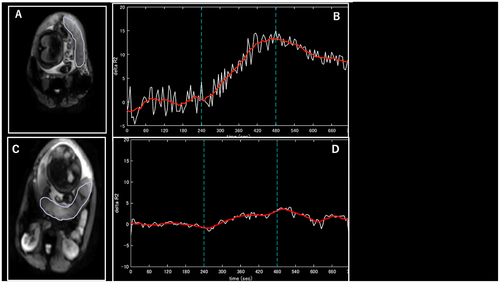
Table 2. Fetal, neonatal, and placental demographics.
Table 3. Comparison between the normal pregnancy group and the COVID-19 group.
Table 4. Results of BOLD-MRI.
Supplemental Material
Download MS Word (14.5 KB)Data availability statement
The data that support the findings of this study are available on request because the data contain potentially identifying or sensitive patient information. This restriction is imposed by the Institutional Review Board (Contact; Data Manager: [email protected]).