
Figures & data
Table 1. Baseline characteristics and clinical information in the macrosomia and control groups.
Figure 1. The classification and percentage of metabolites.
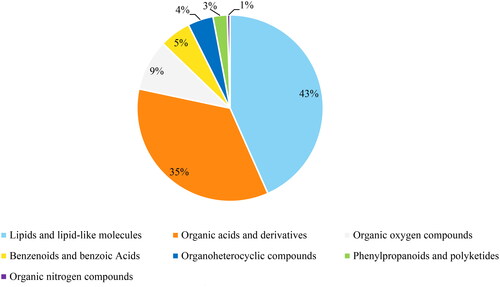
Figure 2. Metabolite profile of the macrosomia group vs. the control group about maternal serum samples. (a) Results of PCA analysis. (b) Results of OPLS-DA model. (c)Permutation test of OPLS-DA model.
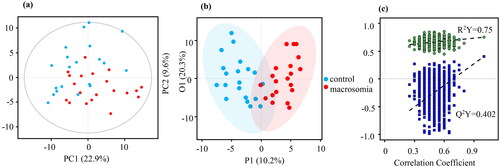
Figure 3. Metabolite profile of the macrosomia group vs. the control group about umbilical cord serum samples. (a) Results of PCA analysis. (b) Results of OPLS-DA model. (c) Permutation test of OPLS-DA model.
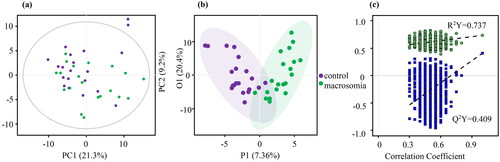
Figure 4. Differential metabolites in maternal serum samples. (a) Volcano plot based on univariate analysis. (b) Volcano plot of OPLS-DA model. (c) Classification of differential metabolites.
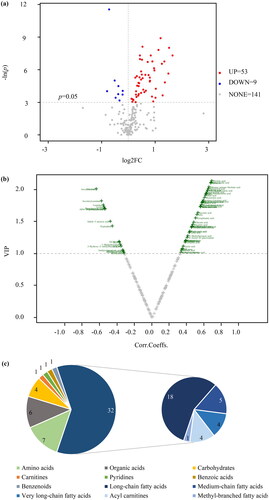
Figure 5. Differential metabolites in umbilical cord serum samples. (a) Volcano plot based on univariate analysis. (b) Volcano plot of OPLS-DA model. (c) Classification of differential metabolites.
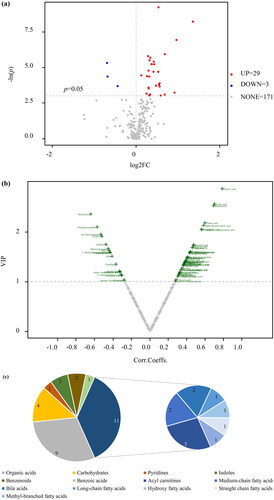
Table 2. Differential metabolites of lipids and lipid-like molecules in maternal serum (μmol/L).
Table 3. Differential metabolites of lipids and lipid-like molecules in umbilical cord serum (μmol/L).
Table 4. Maternal to umbilical cord serum unsaturated fatty acids differences between control and macrosomia subjects.
Figure 6. Common differential metabolites in maternal and umbilical cord serum (μmol/L). (a) lactic acid (b) Aconitic acid (c) Citric acid (d) Isocitric acid (e) 2-Methylhexanoic acid (f)12-Hydroxystearic acid.
* p < 0.05
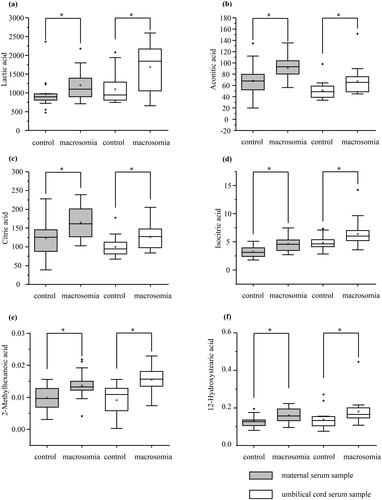
Figure 7. Metabolite set enrichment analysis. (a) The pathways in maternal serum. (b) The pathways in in umbilical cord serum.
The statistically significant pathways were marked with names.
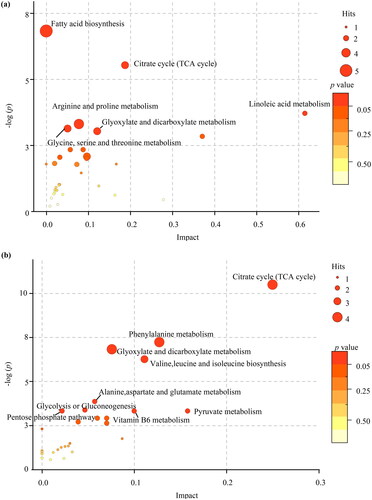
Table 5. Results of correlation analysis between common metabolites and clinical parameters.
Data availability statement
The data that support the findings of this study are available from the corresponding author upon reasonable request.