Figures & data
Table 1. Morphological features of Chlorella species isolated from marine and brackish habitats.
Fig. 1 Molecular phylogeny of the Trebouxiophyceae based on SSU rDNA sequence comparisons. The phylogenetic tree shown was inferred using the Maximum likelihood method based on the data sets (1784 aligned positions of 69 taxa) using PAUP 4.0b10. For the analyses, the best model was calculated by Modeltest 3.7. The setting of the best model was given as follows: TrN + I + G (base frequencies: A 0.2468, C 0.2322, G 0.2778, T 0.2432; rate matrix A-C 1.0000, A-G 2.1652, A-U 1.0000, C-G 1.0000, C-U 5.1240, G-U 1.0000) with the proportion of invariable sites (I = 0.5997) and gamma shape parameter (G = 0.5342). The branches in bold are highly supported in all analyses (Bayesian values > 0.95 calculated with MrBayes; bootstrap values > 70% calculated with PAUP using Maximum likelihood, Neighbour-joining, Maximum parsimony and RAxML using Maximum likelihood). The new sequences presented in this study are highlighted in bold.
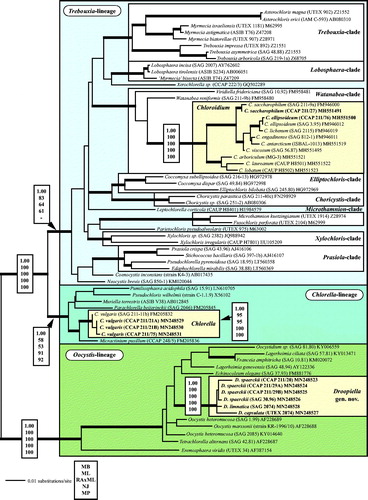
Fig. 2 (2.1) Molecular phylogeny of the genera Chlorella and Micractinium based on SSU and ITS rDNA sequence comparisons. The phylogenetic tree shown was inferred using the Maximum likelihood method based on the data sets (2602 aligned positions of 13 taxa) using PAUP 4.0b10. For the analyses, the best model was calculated by Modeltest 3.7. The setting of the best model was given as follows: GTR + I + G (base frequencies: A 0.2256, C 0.2541, G 0.2751, T 0.2452; rate matrix A-C 0.7854, A-G 1.2408, A-U 1.0687, C-G 0.4617, C-U 3.2928, G-U 1.0000) with the proportion of invariable sites (I = 0.7774) and gamma shape parameter (G = 1.2073). The branches in bold are highly supported in all analyses (Bayesian values > 0.95 calculated with MrBayes; bootstrap values > 70% calculated with PAUP using Maximum likelihood, Neighbour-joining, Maximum parsimony and RAxML using Maximum likelihood). (2.2) TCS haplotype network inferred from ITS-1, 5.8S, and ITS-2 rDNA sequences of Chlorella vulgaris. This network was inferred using the algorithm described by Clement et al. (Citation2002). Sequence nodes corresponding to samples collected from different habitats. The accession numbers of all haplotypes are summarized in Table S3 (see supplemental material online).
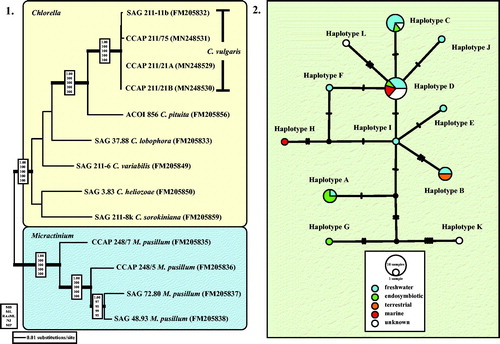
Fig. 3 Molecular phylogeny of the Oocystis lineage (Trebouxiophyceae) based on SSU rDNA sequence comparisons. The phylogenetic tree shown was inferred using the Maximum likelihood method based on the data sets (1778 aligned positions of 23 taxa) using PAUP 4.0b10. For the analyses, the best model was calculated by Modeltest 3.7. The setting of the best model was given as follows: TrN + I + G (base frequencies: A 0.2498, C 0.2263, G 0.2752, T 0.2487; rate matrix A-C 1.0000, A-G 1.5365, A-U 1.0000, C-G 1.0000, C-U 4.1953, G-U 1.0000) with the proportion of invariable sites (I = 0.5925) and gamma shape parameter (G = 0.6827). The branches in bold are highly supported in all analyses (Bayesian values > 0.95 calculated with MrBayes; bootstrap values > 70% calculated with PAUP using Maximum likelihood, Neighbour-joining, Maximum parsimony and RAxML using Maximum likelihood).
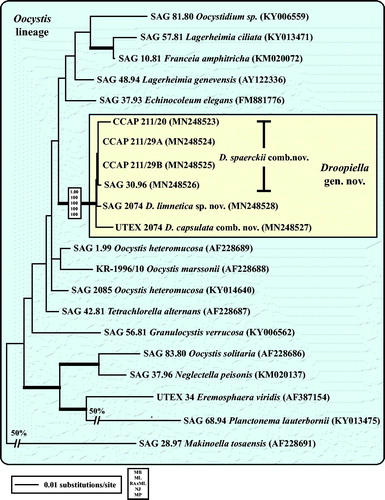
Fig. 4 ITS-1 secondary structures of the Droopiella strains investigated in this study. The variable regions are marked in white boxes.
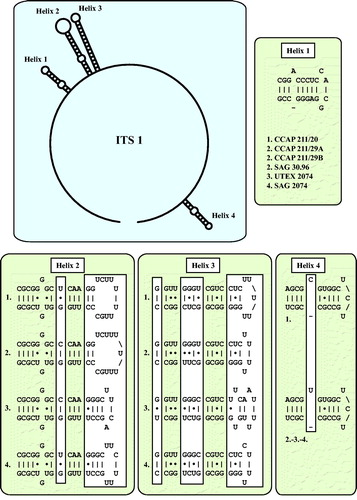
Fig. 5 ITS-2 secondary structures of the Droopiella strains investigated in this study. The variable regions are marked in white boxes.
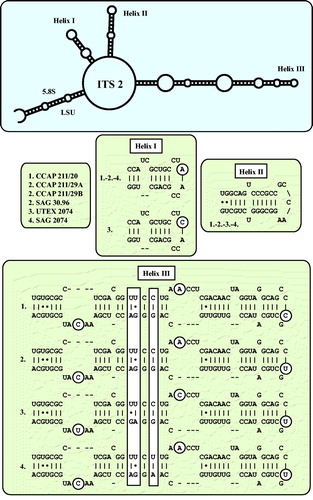
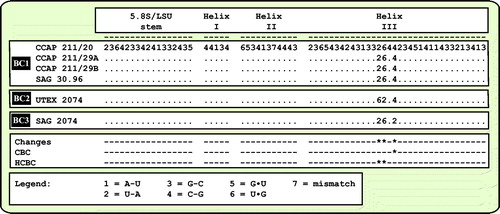
Fig. 6 Comparison of the conserved region of ITS-2 among the species of Droopiella. Extraction of this region and translation into a number code for its usage as barcode (BC1-3).
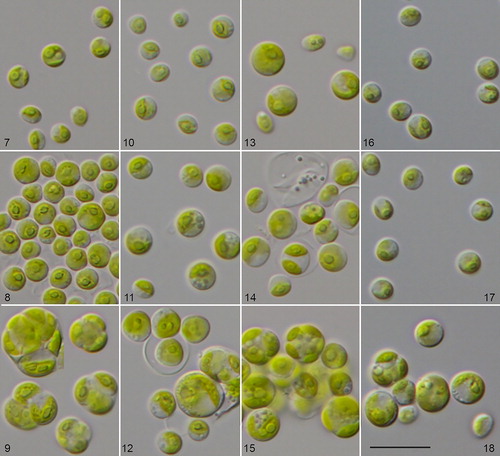
Figs. 7–18 Morphology and phenotypic plasticity of Chlorella vulgaris strains under freshwater (7, 10, 13, 16), brackish (8, 11, 14, 17) and marine conditions (9, 12, 15, 18). 9. CCAP 211/75; 10–12. CCAP 211/21A; 13–15. CCAP 211/21B; 16–18. CCAP 211/11B; scale bar = 20 µm.
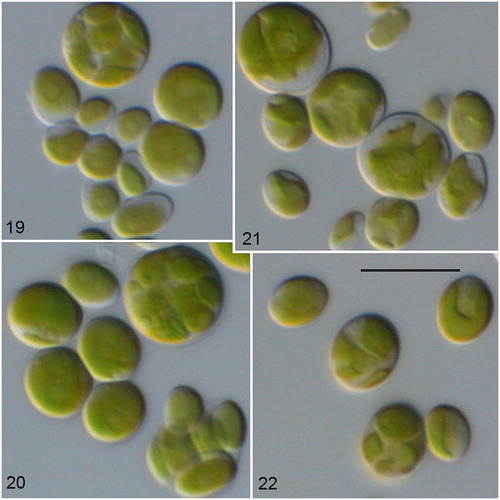
Figs. 19–22 Morphology and phenotypic plasticity of Chloroidium saccharophilum (19–20) and C. ellipsoideum (21–22) under freshwater (19, 21), and marine conditions (20, 22). 19–20. CCAP 211/27; 21–22. CCAP 211/76; scale bar = 10 µm.
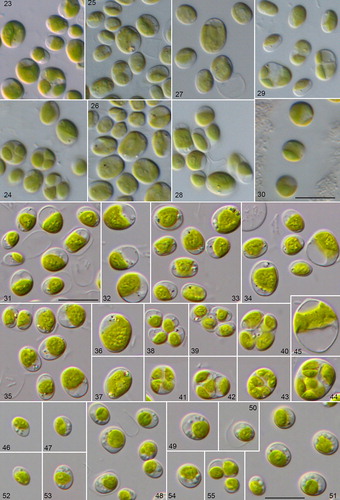
Figs. 23–55 Morphology and phenotypic plasticity of the different Droopiella species. (23-28) D. spaerckii and (29-30) D. capsulata under freshwater (23,25,27,29), and marine conditions (24,26,28,30). Strains: (23-24) CCAP 211/20; (25-26) CCAP 211/29A; (27-28) CCAP 211/29B; (29-30) UTEX 2074; (31-45) D. limnetica sp. nov. (SAG 2074) under freshwater conditions; (46-55) D. spaerckii (SAG 30.96) under brackish conditions; scale bar = 10 μm.