Figures & data
Fig. 1. (1) A random sample of plant species is taken from authoritative checklists that incorporate all known species from a continent. (2) Point localities are taken from herbarium specimens and databases where such localities are compiled. Specimen localities without coordinates are georeferenced. (3) A projection of the range of each of the sampled species is generated using an ensemble of species distribution models, using climatic and topographic variables as predictors. Summing the number of randomly sampled species projected to be present in each gridded pixel gives a projection of species richness. (4) Plant trait values providing dimensions of leaves, seeds and plant height for each of the randomly sampled species are extracted from taxonomic literature such as the descriptions held within Floras. (5) By appending species-level trait values to each projected species, metrics such as functional richness, functional dispersion or functional uniqueness can be calculated for each pixel whose species richness exceeds a minimum number of species. (6) Null models that, for a particular functional diversity metric, provide a confidence interval for each level of species richness allow identification of geographical areas where functional diversity metrics diverge from species richness.
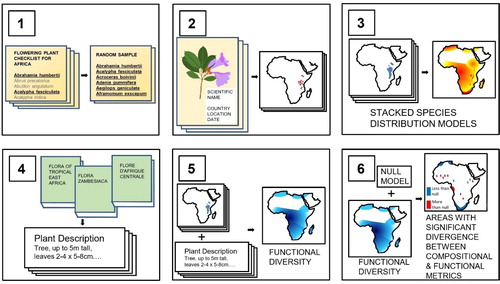
Fig. 2. Potential plant species richness across the continent of Africa based on a random sample of 484 angiosperm species whose localities were extracted from herbarium specimens, mapped to gridded pixels of a twelfth of a degree by a twelfth of a degree. Ensemble species distribution models were used to project species with sufficient points if those models met validity criteria. All other species are mapped using a point-to-grid method. This figure presents an example of how the methodology presented here (particularly up to the stacking of species distribution models in step 3) can be implemented.
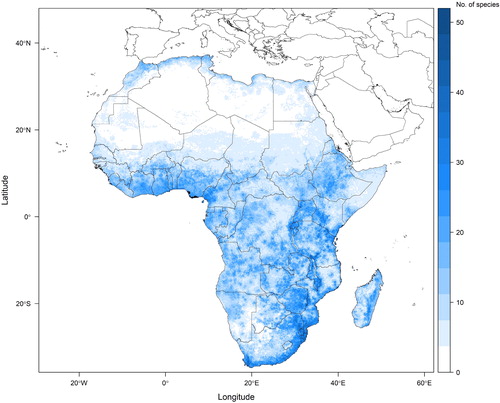
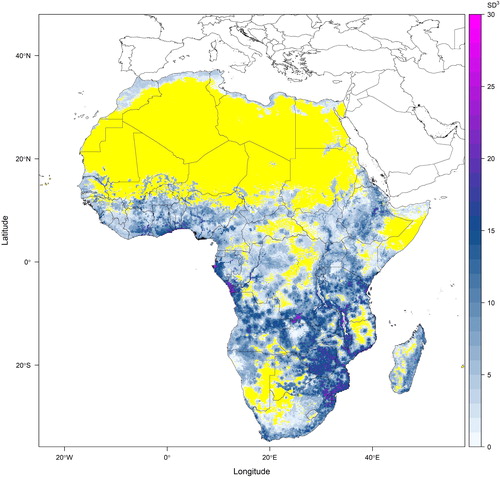
Fig. 3. Potential plant functional richness based on sampled species composition for Africa projected using the stacked species distribution models presented in . Species-level trait values of leaf area, seed volume and plant height were extracted from Floras and taxonomic literature (see Supplemental Data) and standardised such that the volume of occupied trait-space (functional richness measured using a convex hull method) had the units of trait value standard deviations raised to the power of three (because three traits were considered). This figure presents an example of the output of the fifth step of the proposed methodology. The yellow regions on this map are areas where the random sample of species has insufficient species to calculate functional richness.