Figures & data
Fig. 1. Sampling area map (Kuril-Kamchatka Trench region). Overview of sampling areas of the KuramBio II (KBII) and SokhoBio (SKB) expeditions in the greater Kuril-Kamchatka Trench region of the North-west Pacific, divided into four different geographic zones following Johannsen et al. (Citation2020).
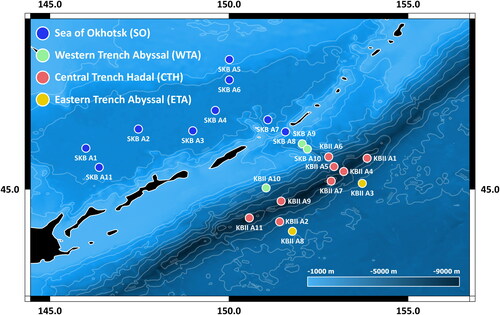
Table 1. 16S and COI intracluster p-distances. Intraspecific variation (mean uncorrected p-distances and range in brackets) within each genotypic cluster for the 16S and the COI gene respectively. N/A denotes cases in which calculation of p-distance was not possible due to low sequence counts.
Table 2. 16S and COI intercluster p-distances. Mean uncorrected p-distances between each genotypic cluster of the H. belyaevi species complex and other species of the genus Haploniscus for 16S (below diagonal) and COI data (above diagonal) respectively, representing mean interspecific divergence. N/A denotes cases in which calculation of p-distance was not possible due to the unavailability of molecular sequences for certain clusters and the respective gene.
Fig. 2. CLSM images of adult males within the Haploniscus belyaevi species complex. Dorsal habitus CLSM scans of copulatory males from three different phenotypic clusters within the H. belyaevi species complex: H. ‘KKT’ (KBII Hap165 (1)), H. ‘SO’ (SKB Hap06 (2)), and H. aff. belyaevi (SKB Hap54 (3)).
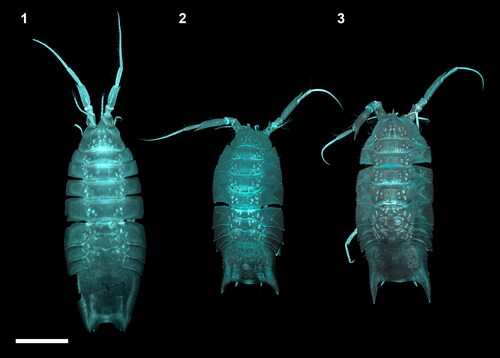
Fig. 3. Ontogenetic development of the manca stages of the Haploniscus belyaevi species complex. Ventral pleotelson CLSM-scans of three different phenotypic clusters H. ‘KKT’ (KBII Hap227 (1), KBII Hap234 (2), KBII Hap107 (3)), H. ‘SO’ (SKB Hap45 (4), SKB Hap12 (5), SKB Hap39 (6)) and H. aff. belyaevi (SKB Hap09 (7), SKB Hap30 (8), SKB Hap52 (9)) across the three successive ontogenetic stages: manca I (1, 4, 7), manca II (2, 5, 8) and manca III (3, 6, 9). Arrows on manca II specimens indicate the subcuticular anlagen of the developing seventh pereopods.
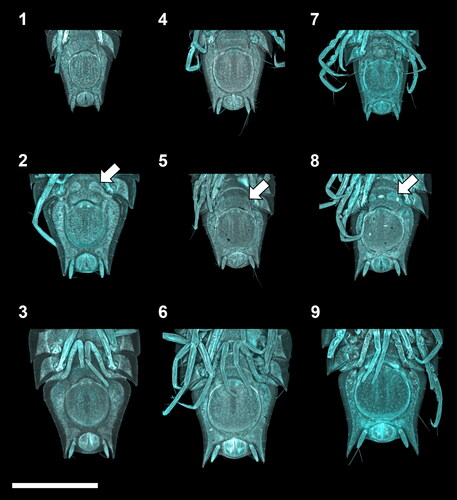
Fig. 4. Ontogenetic development of the adult male stages of the Haploniscus belyaevi species complex. Ventral pleotelson CLSM-scans of three different phenotypic clusters H. ‘KKT’ (KBII Hap119 (1), KBII Hap216 (2), KBII Hap165 (3)), H. ‘SO’ (SKB Hap19 (4), SKB Hap06 (5)) and H. aff. belyaevi (SKB Hap54 (6)) across the three successive ontogenetic stages: juvenile male IV (1, 4), preparatory male V (2) and copulatory male VI (3, 5, 6).
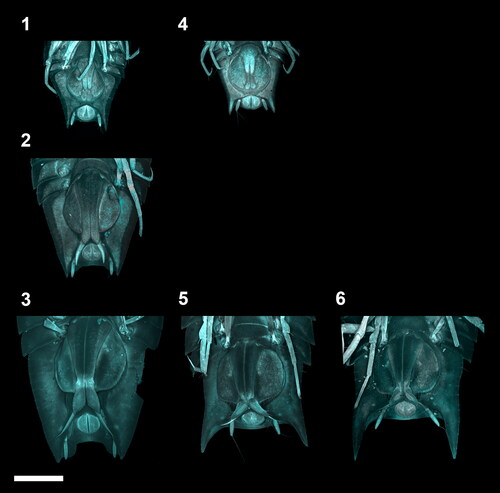
Fig. 5. Ontogenetic development of the adult female stages of the Haploniscus belyaevi species complex. Ventral pleotelson CLSM-scans of three different phenotypic clusters H. ‘KKT’ (KBII Hap123 (1), KBII Hap219 (2), KBII Hap118 (3)), H. ‘SO’ (SKB Hap41 (4), SKB Hap23 (5)) and H. aff. belyaevi (SKB Hap50 (6)) across the three successive ontogenetic stages: preparatory female IV early instar (1, 4), preparatory female IV late instar (2, 5, 6) and ovigerous female V (3). The female IV stage is depicted twice to compare specimens of its first and last instar. Depicted differences in shape and size between these instars are the result of a gradual development over multiple moults that did not justify the erection of additional stages. The ovigerous female V specimen of H. ‘KKT’ could not be scanned in a standardized view without the risk of damaging the specimen due to a pronounced body curvature.
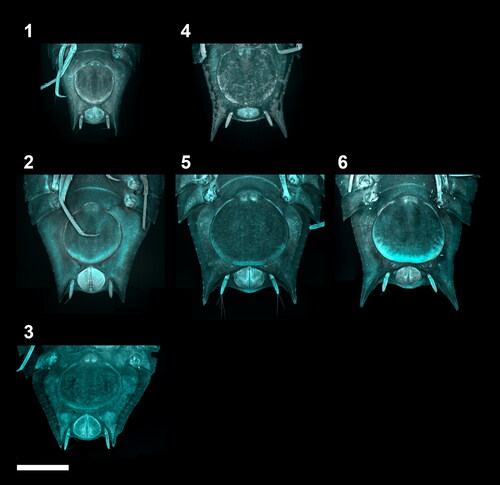
Fig. 6. Ontogenetic body-length frequency of the Haploniscus belyaevi species complex. Bodylength-frequency histograms of ontogenetic stages for three analyzed phenotypic clusters (H. aff. belyaevi, H. ‘KKT’ and H. ‘SO’) and genotypic clusters within. Stages represented include manca I–III, juvenile ♂ IV, preparatory ♂ V, copulatory ♂ VI, preparatory ♀ IV and ovigerous ♀ V.
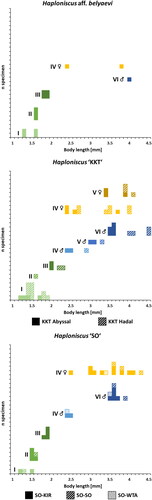
Fig. 7. Barcoding–gap analysis of the Haploniscus belyaevi species complex. Stacked (i.e., placed on top of each other) histograms contrasting the intraspecific variations of the phenotypic clusters H. aff. belyaevi (SKB Hap50), H. ‘KKT’ (KBII Hap201), H. ‘SO’ (SKB Hap20) with their interspecific divergences (also considering H. profundicolus) based on uncorrected p-distances of the 16S alignment (1) and the COI alignment (2).
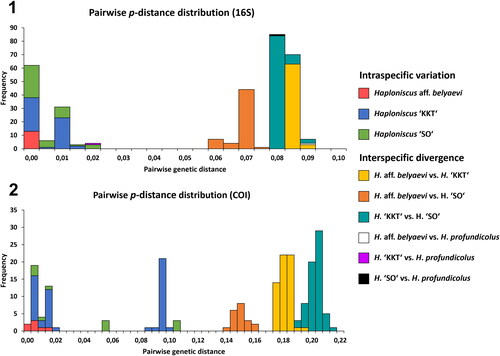
Fig. 8. Consensus phylogenetic tree (16S and COI) of 186 haploniscid isopods. Sequence allocation to distinct clusters based on ASAP and mPTP analyses (white rings) and morphological identity (coloured background) is highlighted. Sequences are genetically clustered based on the results of an ASAP-analysis for the 16S (circle) and COI gene (triangle) as well as a mPTP-analysis (diamond). Shaded ring segments indicate gaps within a cluster due to missing molecular data of the specimens in question for this gene.
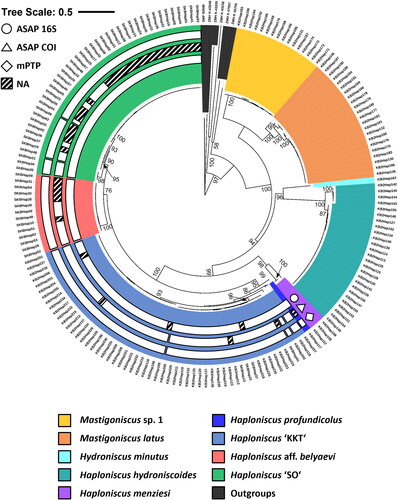
Fig. 9. 16S (1) and COI (2) haplotype networks of the Haploniscus belyaevi species complex and H. profundicolus. Haplotypes are colour-coded after their sampling area and geographic area following Johannsen et al. (Citation2020). Circled numbers represent mutation steps for improved clarity. HT, haplotype.
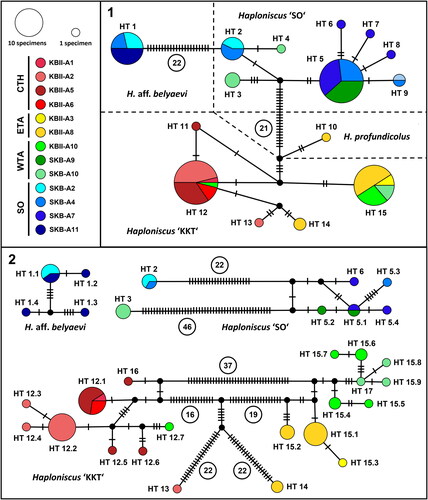
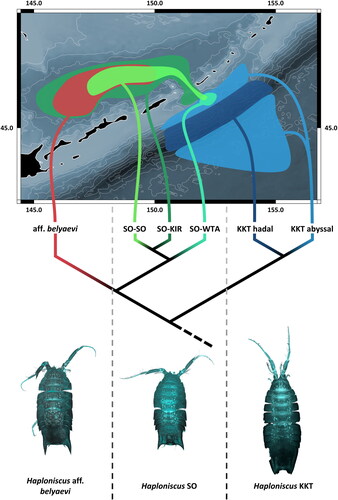
Fig. 10. Phylogeography of the Haploniscus belyaevi species complex in the Kuril-Kamchatka Trench region. Morphological diversity (bottom), simplified phylogenetic diversity (middle) and schematic geographic distribution (top) of each of the six distinct species of the H. belyaevi complex are visualized.