Figures & data
Fig. 1. Distributions of the four currently recognized large-sized species of Vampyressa. Distribution polygons follow Tavares et al. (Citation2014), Morales-Martínez et al. (Citation2021), and Marsh et al. (Citation2022). Filled circles indicate collecting localities of specimens that have only morphological data available and open squares represent the localities of specimens from which we obtained molecular data.
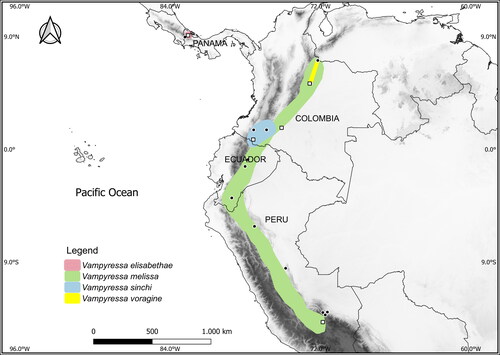
Table 1. Pairwise mean sequence divergence between species of Mesophylla and Vampyressa under the Kimura 2-parameter model, as implemented in MEGA7 for a total of 31 cytochrome b sequences (1,140 bp). Intraspecific divergence is shown in bold in the diagonal.
Table 2. Selected diagnostic characters of Vampyressa species.
Fig. 2. Tree estimated in BEAST based on mitochondrial cytochrome b gene sequences of Vampyressa and Mesophylla. Vertical bars show the comparison of the five species delimitation results as follows: sGMYC, single-threshold Generalized Mixed Yule-Coalescent (GMYC); bGMYC, Bayesian Implementation of the GMYC (using a posterior probability threshold of P = 0.6); bPTP, Bayesian Implementation of the Poisson tree processes (PTP) model; mPTP, multirate Poisson tree processes model; ABGD, Automatic Barcode Gap Discovery (using a prior maximum distance P of 0.011 ≤ P ≤ 0.030). The six putative species are indicated with different colours: Vampyressa thyone (pink), Vampyressa sp. (grey), V. pusilla (orange), V. melissa (green), V. voragine (yellow), V. elisabethae (dark orange), and Mesophylla macconnelli (blue). The ultrametric gene tree shown was estimated in BEAST. Acronyms: FMNH, Field Museum of Natural History, Chicago, IL, USA; ICN, Colección de mamíferos ‘Alberto Cadena García’, Instituto de Ciencias Naturales, Universidad Nacional de Colombia, Bogotá, Colombia; MZFC, Mammal Collection of the Zoology Museum, UNAM, Facultad de Ciencias, Universidad Nacional Autónoma de México, Mexico City, Mexico; TK, TTU, Museum of Texas Tech University, Lubbock, TX, USA; USNM, National Museum of Natural History, Smithsonian Institution, Washington, DC, USA.
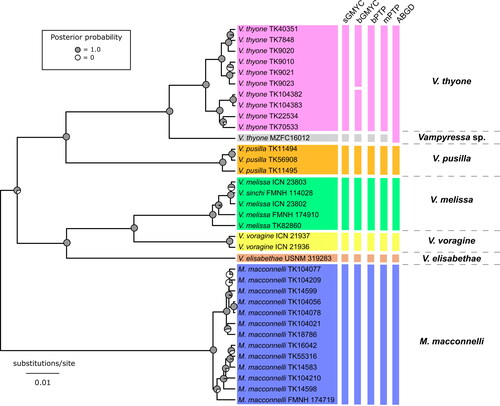
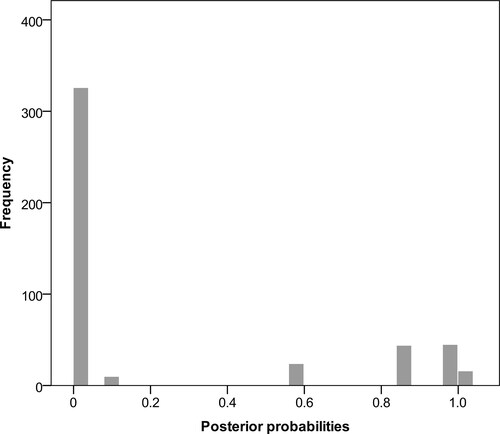
Fig. 3. Histogram of pairwise probabilities of conspecificity for the 35 sequences included in our analyses. Values were obtained from the Bayesian implementation of the Generalized Mixed Yule-Coalescent species delimitation model.