Figures & data
Figure 1. A–C, location map; stratigraphy and geological setting of the type locality (Piña, Chagres district, Costa Abajo, Colon Panama) after Collins et al. (Citation1996).
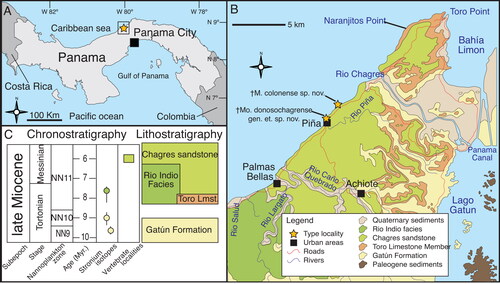
Figure 2. Generalized istiophorid rostrum (modified from Fierstine & Voigt Citation1996): A, left lateral view; B, dorsal view; C, ventral view. Abbreviations for characters: DVS, distribution of denticles on the ventral surface; DZ, distribution of denticles on the dorsal surface of the rostrum; i pr, internal process of maxilla; L, bill length; m pr, maxillary process; NC, narial cavity; ORB, orbital region; P, position of prenasal bone from the distal tip of the rostrum; tr, triangular region of maxilla; VA, ventral aperture; VSPM, length from the tip where fused premaxillaries divide into two separate bones. The abbreviations of bone names are listed in the methodology, illustrations have been modified from Fierstine & Voigt (1996).
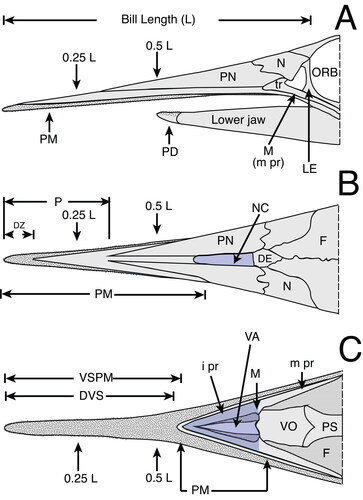
Figure 3. A, B, characters studied with emphasis on two regions of the rostrum: 0.5 L, half of the distance between the distal tip and the orbital margin of the lateral ethmoid bone and 0.25 L, one-fourth the distance between the distal tip and the orbital margin of the lateral ethmoid bone; A, cross-section view at 0.5 L; B, cross-section view at 0.25 L; C, left dentary on medial view of the interdentary joint. Character abbreviations: depth (D1, D2) and width (W1, W2) of the rostrum, height (H1, H2) and width (N1, N2) of the left internal canal (as seen in cross-section), intercanal distance (IC1, IC2) and distance of the internal canal from dorsal surface (DD1, DD2). Depth from the anterior-most denticles perpendicular to the ventral margin of the dentary (not to the distal margin, which often has projection) (DAD), and length of the intermediary joint from the mandibular foramen to the anterior-most denticles (DJL). Mandibular foramen = mf. Modified from Fierstine & Voigt (Citation1996) and Fierstine (Citation2001).
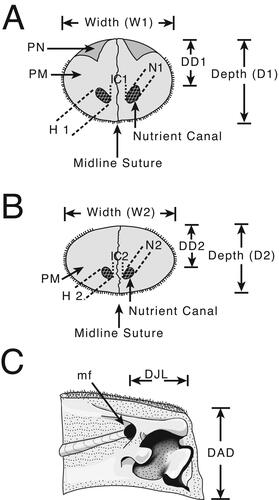
Table 3. Relationship between height of left nutrient canal at 0.5 L (H1) with the CA1/AR1 ratio (canal area / cross-section area at 0.5 L). Using H1 as size estimator, small nutrient canals range between 1.0 and 3.9 mm and big canals range between 4.0 and 8.5 mm. The ratio CA1/AR1 removes the size effect and small canals have values CA1/AR1 of 0.002–0.019 and big canals of 0.02–0.07. In the score column ‘b’ is big and ‘s’ is small for the H1 and CA1/AR1 variables. For †Makaira purdyi variables at 0.25 L were used given the special morphology of this species. Ranges were defined after studying fossils and modern specimens together (Table S1).
Table 1. Mean (x), observed range, and number of specimens examined (n) for nine rostral and one dentary ratios of eight Istiophoridae billfish compared with three fossil species. Abbreviations of the ratio are explained in the methodology and in the legends of , and . Values presented here for marlins were obtained after data imputation. The variable DD1/D1 for K. audax and all data from spearfishes (Tetrapturus ssp.) were taken from Fierstine (Citation2001). ‘NA’ non-available data, ‘*’ indicates out of range values if compared with modern species.
Table 2. Score sheet of nine rostral ratios of seven modern billfish species compared with three fossil species. The first number is the number of ratios on the range and the second number is the total of analysed ratios of each region. The total score indicates the number of ratios of fossil species on the rage for each modern species. For †Mo. donosochagrense gen et. sp. nov. one ratio of dentaries is analysed.
Figure 5. A–C, G–I, †Morgula donosochagrense gen. et sp. nov., holotype (MUPAN–STRI31293); A, rostrum dorsal view; B, rostrum left lateral view; C, rostrum ventral view; G–I, lower jaw showing articulate dentaries; G, ventral view; H, dorsal view; I, disarticulated right partial dentary in lateral view showing the interdentary joint and the mandibular foramen. D–F, †Makaira fierstini sp. nov., holotype, USNM 358534; D, rostrum dorsal view; E, rostrum ventral view; F, detail of the right lateral view of the rostrum at its proximal end. Missing parts of the bone are indicated by dash-lines. Abbreviations: mf, mandibular foramen; N, nasal; PM, premaxilla; PN, prenasal. Scale bars: A–F = 10 cm, G–I = 5 cm.
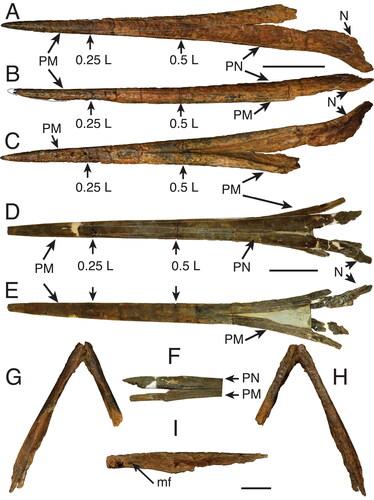
Figure 6. A, B, †Morgula donosochagrense gen et sp. nov. (MUPAN–STRI31293); A, cross-section at 0.5 L; B, cross-section at 0.25 L. C, D, †Makaira colonense sp. nov. (MUPAN–STRI39292); C, cross-section at 0.5 L; D, cross-section at 0.25 L. Abbreviation: PN, prenasal. Scale bars = 1 cm.
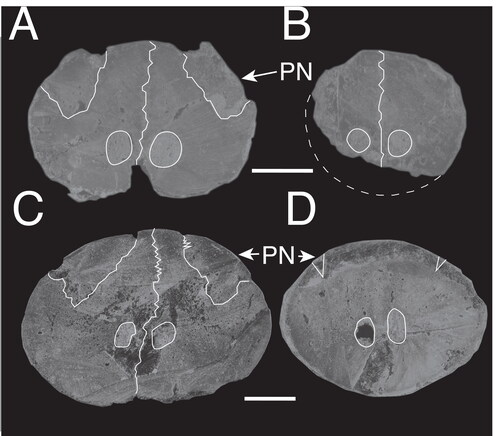
Figure 7. A–L, comparison among selected fossils and extant marlin species with emphasis on the rostral morphology and its cross-sections at 0.5 and 0.25 L; A, reconstruction of the rostrum of †Prototetrapturus courcelli gen. et. comb. nov. (MNHN P250); B, reconstruction of the rostrum of †Spathochoira calvertense gen. et. comb. nov. (USNM 9344); C, †Morgula donosochagrense gen. et sp. nov. (MUPAN–STRI31293); D, †Makaira colonense sp. nov. (MUPAN–STRI31292); E, reconstruction of the rostrum of Makaira panamense (USNM 181710); F, reconstruction of the rostrum of †Makaira belgica (MAUL 917/1) from the late Miocene of Italy; G, †Makaira fierstini sp. nov. (USNM 358534); H, Makaira nigricans (USNM 196019); I, Istiompax indica (LACM 25509); J, Kajikia albida (USNM 360507); K, Kajikia audax (USNM 372777); L, Istiophorus platypterus (MNHN A-9463). The white circle indicates the point where fused prenasals start to divide in two separate bones, if this point is more distal, the narial cavity is longer and rostrum is more open. Arrows indicates where premaxillaries protrude from prenasals in Makaira ssp., the outer projection of the prenasals is represented by an angle symbol. Cross-sections at 0.5 and 0.25 L: blue is oval shape, light blue is oval shape compressed laterally (borders could be more angular instead of smooth and prenasals are embedded into premaxillaries; see ), green is round, yellow is oval highly depressed (almost plane), red represents other shapes (see ). Pink water mark indicates the reconstructed sections. Different rostrums are labelled according the observed or inferred feeding strategy. Thrusting refers to rostrums used mostly for direct impacts and specific refers to rostrums used in multidirectional, lateral or complex feeding strategies. Scale bars = 10 cm.
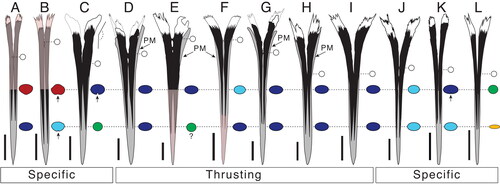
Figure 8. A–D, Istiophoridae holotypes represented by fragmented rostrums in dorsal, right lateral and ventral view; A, †Spathochoira calvertense gen et. comb. nov. (USNM 9344), holotype; B, Makaira belgica (IRSNB P1117), holotype; C, †Prototetrapturus courcelli gen et. comb. nov. (MNHN P250), holotype; D, Makaira purdyi (USNM 481933), holotype. Dashed black lines show the positions where the sections at 0.5 L and 0.25 L have been studied. White dashed lines indicates the prenasal sutures. Scale bar = 5 cm.
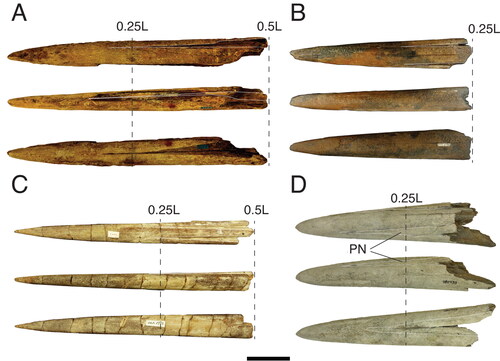
Figure 9. A–E, Cross-sections of fossil istiophorids. †Prototetrapturus courcelli gen. et. comb. nov. (MNHN P250): A, cross-section at the proximal end of the rostrum; B, cross-section at 92 mm measured from its proximal end; C, cross-section at 139 mm measured from its proximal end; D, cross-section at 200 mm measured from its proximal end; E, cross-section at 260 mm measured from its proximal end, F, †Makaira purdyi (USNM 481933), cross-section at 0.25 L distance. G, †Makaira panamense (USNM 481933), cross-section approximately at 0.5 L distance (prenasal sutures are not shown due to the poor preservation state). H, I, N, †Makaira belgica, MAUL 917/1; H, cross-section at 0.5 L and I, 0.25 L distance; IRSNB P117; N, cross-section at 0.25 L distance (prenasal sutures are not shown due to the poor preservation). J, K, †Spathochoira calvertense gen et. comb. nov. (USNM 9344) at J, 0.5 L and K, 0.25 L; L, M, extant I. platypterus at L, 0.5 L and M, 0.25 L; O, †Xiphiorhynchus solidus (IRSNB P643), cross-section at the proximal end of the rostrum. Dashed lines show reconstruction of missing sections. The black arrow in I, shows the dorsal placement of the internal canals. In J, K, the arrows show the ventral external canal in cross-section at 0.5 L and 0.25 L distance. Scale bars = 1 cm.
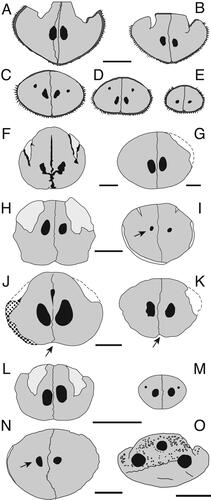
Table 4. Estimated body size (LJFL and TL) in fossil istiophorids using the VSPM distance as an allometric predictor. Species range suggests which extant species or genera fit better with the fossil specimen according the morphology and by the size ranges established by Nakamura (1983). Abbreviations: LJFL, lower jaw fork length; TL, total length; VSPM, length from the distal tip to the point where the fussed premaxillaries start to divide in two separate bones.
Figure 10. A, PCA morphospace for MAR obtained values from 110 modern marlin individuals distributed in five extant species and 11 fossil specimens. B, probability density function for five modern marlin species and its probabilistic associations with fossil specimens based on the PCA analysis. The PCA explains 90.9% of total variation in the first two axes. In B, the numbers correspond with those in the PCA analysis for species names. Grey lines are the 95% confidence intervals for extant species and the lines represent the distances of each fossil individual. For the three individuals identified as Istiophoridae sp. 1 the correspondence between the numbers in parenthesis and the collection number is: MAUL 57/1 (3), MUPPAN– STRI 31291 (6) and OCPC 31001 (7).
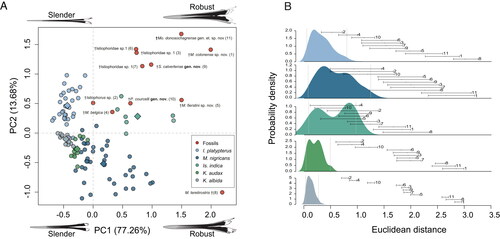
Figure 11. A–C, †Makaira colonense sp. nov. (MUPAN–STRI 39292), rostrum; A, dorsal view; B, right lateral view; C, ventral view. D–G, †Makaira panamense (USNMN 18710), holotype; D, skull in dorsal view; E, skull ventral view; F, left lateral skull view; G, occipital region. Scale bars: A–C, F = 10 cm; D, E = 20 cm; G = 4 cm.
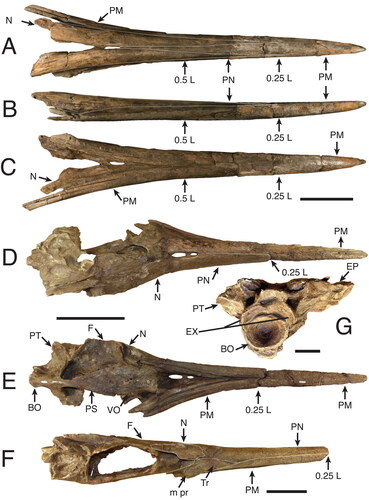
Figure 12. A, †Makaira teretirostris (Van Beneden, Citation1871); original diagram (Van Beneden Citation1871) with detailed cross-sections highlighted that show a cylindrical shape. B, C, Tetrapturus sp. from the late Pliocene of Orciano Formation; B, rostrum in dorsal view; C, rostrum in ventral view. Scale bars A = 10 cm, B = 5 cm.
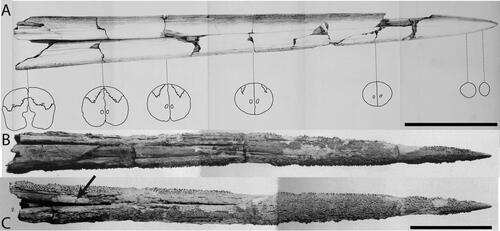
Figure 4. Maximum likelihood constrained topology based on Williams et al. (Citation2018) for istiophorid billfishes. Colours indicate different clades that are correlated with different types of rostra and behaviours based on extant species. The definition for the rostra shape is detailed in the character matrix (Supplemental material Table S2). The skull figures in ventral view show the morphology of the neurocranium, vomer and parasphenoid in different clades. The colours for skull bones are explained in . The rostrum and drawings on the button show how each type of rostra correlated with a different feeding behaviours based on observations in extant species. The silhouettes of the three main types of rostra described are compared with drawings of different types of swords for better understanding of the rostral morphology. Green is extremely thin rostra similar to a fencing sword; blue illustrates robust rostrums compared with a ‘gladius hispaniensis’ or ‘Mainz-type swords’, as shown in Bishop (Citation2016, pp. 18–21); red shows slender rostrums compared with a Viking sword (see Oakeshott [Citation1960] for examples of this type of sword) and orange indicates the same rostrum type as red. Colours also show the convergence of different rostral, vomer and parasphenoid shapes in our topology. The Tetrapturus clade (orange) includes species with slender rostra similar to the Gracilorosta clade (red) but no information about the feeding behaviour in spearfishes is available.
![Figure 4. Maximum likelihood constrained topology based on Williams et al. (Citation2018) for istiophorid billfishes. Colours indicate different clades that are correlated with different types of rostra and behaviours based on extant species. The definition for the rostra shape is detailed in the character matrix (Supplemental material Table S2). The skull figures in ventral view show the morphology of the neurocranium, vomer and parasphenoid in different clades. The colours for skull bones are explained in Figure 13. The rostrum and drawings on the button show how each type of rostra correlated with a different feeding behaviours based on observations in extant species. The silhouettes of the three main types of rostra described are compared with drawings of different types of swords for better understanding of the rostral morphology. Green is extremely thin rostra similar to a fencing sword; blue illustrates robust rostrums compared with a ‘gladius hispaniensis’ or ‘Mainz-type swords’, as shown in Bishop (Citation2016, pp. 18–21); red shows slender rostrums compared with a Viking sword (see Oakeshott [Citation1960] for examples of this type of sword) and orange indicates the same rostrum type as red. Colours also show the convergence of different rostral, vomer and parasphenoid shapes in our topology. The Tetrapturus clade (orange) includes species with slender rostra similar to the Gracilorosta clade (red) but no information about the feeding behaviour in spearfishes is available.](/cms/asset/4358cf31-edc8-47bb-89be-949339a1dc23/tjsp_a_2091959_f0004_c.jpg)
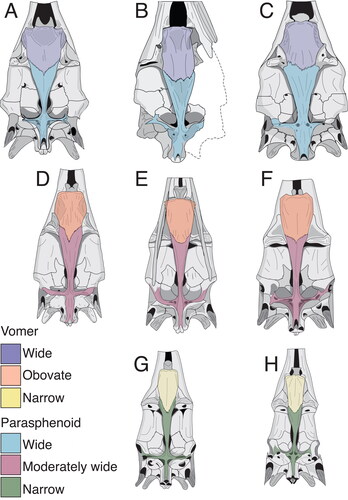
Figure 13. A–H, skull shape variation in fossil and extant istiophorids with emphasis in the basicranium; A, Istiompax indica; B, †Makaira panamense; C, Makaira nigricans; D, Istiophorus platypterus; E, Kajikia audax; F, Kajikia albida; G, Tetrapturus pfluegieri; H, Tetrapturus angustirostris. Colours shows the changes of shape in the vomer and parasphenoid. Wide vomer is associated with wide parasphenoid; obovate vomer is related to moderately wide vomer and narrow vomer is associated with narrow presphenoid. See Supplemental material Table S3 for the definition of these shapes.