
Figures & data
Table 1. Questionnaire topics.
Table 2. Patient demographics.
Table 3. Path to diagnosis.
Figure 1. Physical Symptoms at their Worst or Most Severe. Patients indicated symptoms experienced in their most severe form over the past 12 months. For each symptom selected, patients indicated symptom severity and frequency. Severity was recorded on a 1–7 Likert scale (1 = Very Mild and 7 = Very severe). Frequency was recorded via selection from the following options: Multiple times per day, Daily, Every other day, Twice a week, Once a week, or Every other week. Spheres sizes in chart are proportional to the percent of patients who selected each symptom. The most widely reported physical symptom experienced in its most severe form, bloating, was experienced by 35% of patients.
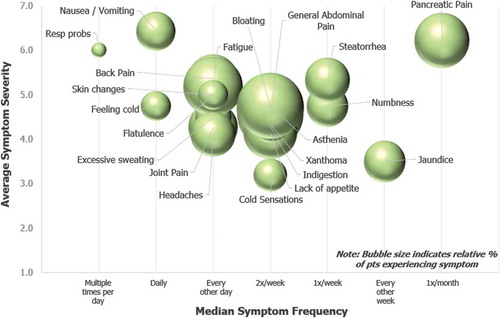
Figure 2. Cognitive Symptoms at their Worst or Most Severe. Patients indicated symptoms experienced in their most severe form over the past 12 months. For each symptom selected, patients indicated symptom severity and frequency. Severity was recorded on a 1–7 Likert scale (1 = Very Mild and 7 = Very severe). Frequency was recorded via selection from the following options: Multiple times per day, Daily, Every other day, Twice a week, Once a week, or Every other week. Spheres sizes in chart are proportional to the percent of patients who selected each symptom. The most widely reported cognitive symptom experienced in its most severe form, difficulty concentrating, was experienced by 18% of patients.
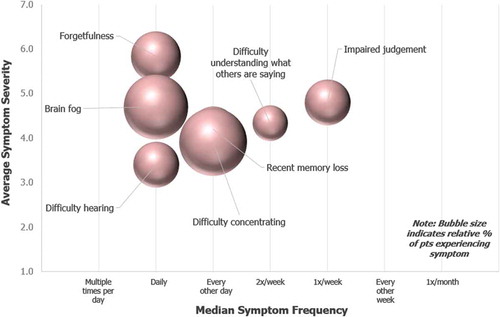
Figure 3. Emotional Symptoms at their Worst or Most Severe. Patients indicated symptoms experienced in their most severe form over the past 12 months. For each symptom selected, patients indicated symptom severity and frequency. Severity was recorded on a 1–7 Likert scale (1 = Very Mild and 7 = Very severe). Frequency was recorded via selection from the following options: Multiple times per day, Daily, Every other day, Twice a week, Once a week, or Every other week. Spheres sizes in chart are proportional to the percent of patients who selected each symptom. The most widely reported emotional symptom experienced in its most severe form, constant uncertainty about having an attack of pain or AP at any time, was experienced by 33% of patients.
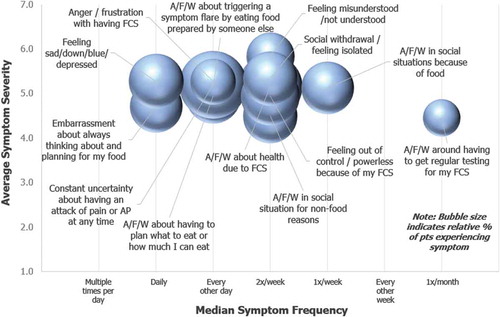
Table 4. Top symptoms at most severe symptomology.
Figure 4. Impact of FCS on employment status and career choice. Patients indicated their current employment status (a), and the impact of FCS on their employment status (b). Impact of FCS on employment status of homemakers and unemployed patients (c), and influence of FCS on patients’ career choice reported using a 1–7 Likert scale where 1 = No impact at all and 7 = Significant impact (d).
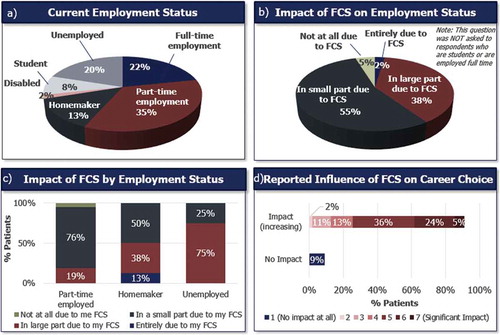
Figure 5. Impact of FCS on ability to perform responsibilities at school or work and time off from work due to FCS. Impact of FCS with ability to fulfill responsibilities at school or work (a). Responses were recorded on a 1–7 Likert scale where 1 = No impact at all and 7 = significant impact. Number of days taken off work in the past 12 months, asked to patients who were full- or part-time employed (N = 34) (b).
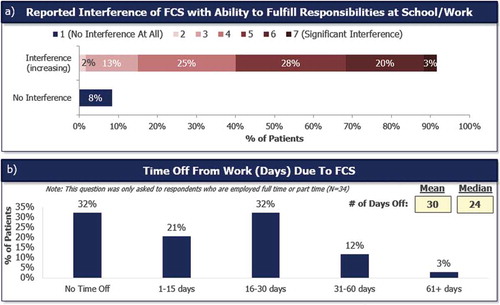
Table A1. Top comorbidities due to FCS.