Figures & data
Table 1. Sample characteristics – population size, gender, age, stature, body mass, and body mass index (BMI).
Figure 1. Percentiles of peak systolic blood pressure (SBP) in function of Wpeak achieved in healthy participants plotted on the same graph as the similar data of post-operative CoA patients.
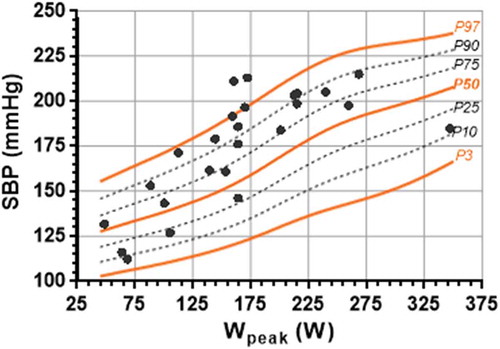
Figure 2. Percentiles of peak circulatory power (CircP) in function of Wpeak achieved in healthy participants plotted on the same graph as the similar data of post-operative CoA patients.
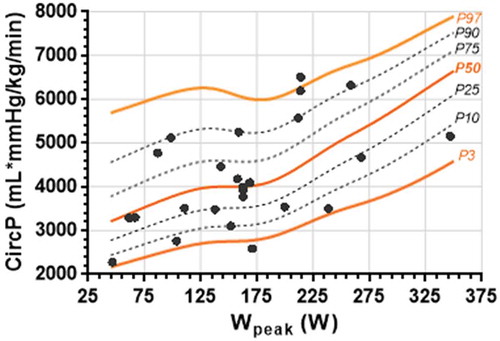
Figure 3. Percentiles of peak rate pressure product (RPP) in function of Wpeak achieved in healthy participants plotted on the same graph as the similar data of post-operative CoA patients.
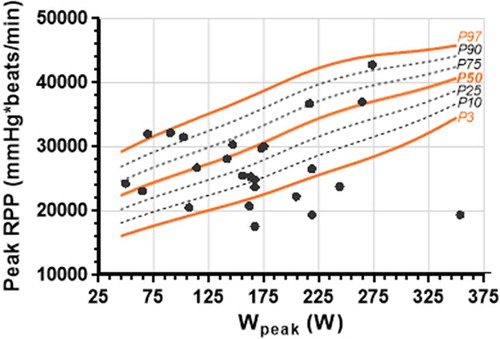
Table 2. Predictive equations of peak SBP, CircP, and RPP in function of Wpeak (W) based on the LMS method.
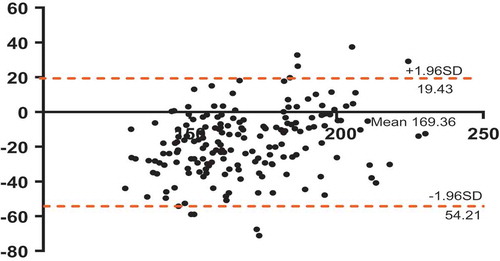
Figure 4. A Bland-Altman plot illustrating the agreement between the healthy systolic blood pressure (SBP) data that this study recorded and the SBP data that was outputted by the Heck et al. predictive equation (SBP = 0.333*(Wpeak) +120.0). The dotted lines annotate the upper and lower 95% confidence interval values.