
Figures & data
Figure 1. Increasing transmitral gradients (a-c) and tricuspid peak velocity (related directly to PA systolic pressure) (B & D) during exercise stress echocardiography.
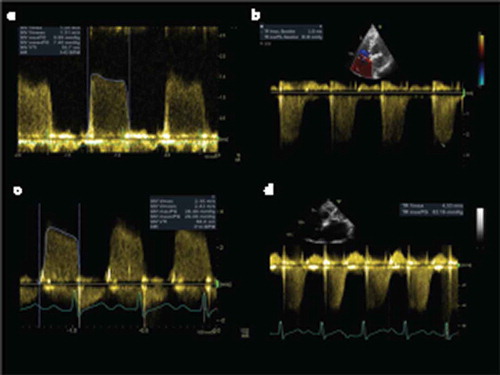
Figure 2. (a) 2 and 3D transoesophageal echocardiography demonstrating extensive severe annular and leaflet calcification resulting in degenerative MS. (b) Circumferential annular calcification demonstrated by multislice computerised tomography.
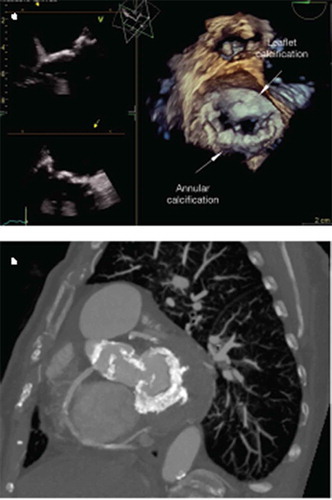
Figure 3. Proposed algorithm for the evaluation and treatment of patients presenting with symptomatic mitral stenosis in circumstances not covered by ESC/EACTS guideline [Citation1].
![Figure 3. Proposed algorithm for the evaluation and treatment of patients presenting with symptomatic mitral stenosis in circumstances not covered by ESC/EACTS guideline [Citation1].](/cms/asset/ed7c6035-f0dc-4452-a641-993a0e4d43ac/ierk_a_1632190_f0003_oc.jpg)