
Figures & data
Figure 1. Forest Plot Showing Relative Risk Of Stroke And TIA Between Transradial And Transfemoral Percutaneous Coronary Intervention At Different Time Intervals
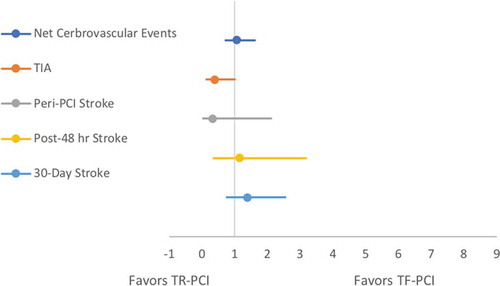
Table 1. Baseline Characteristics Of Patients In The TR And TF Groups
Data Availability
The data supporting the findings of this study are available from the corresponding author upon reasonable request.