
Figures & data
Figure 1. Flowchart of article selection.
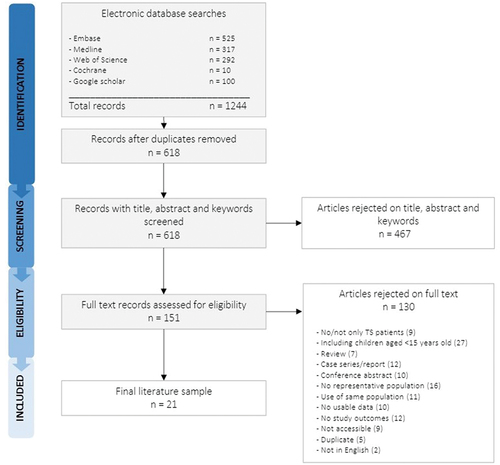
Table 1. Patient characteristics at baseline of the included studies.
Figure 2. Forest plot of prevalence of aortic dilatation defined as an ASI > 20 mm/m2 in the ascending aorta. Heterogeneity as assessed by I2 was 57.5%. CI = confidence interval, RE = random effects.
Figure 3. Forest plot of the incidence of aortic dissections per 100.000 person-years. Heterogeneity as assessed by I2 was 73.1%. CI = confidence interval, RE = random effects.
Table 2. Pooled estimates of absolute and indexed aortic diameters, and aortic growth at the level of the aortic root, ascending, and descending aorta.
Table 3. Description of aortic dissection cases in included studies.
Supplemental material