Figures & data
Figure 1. This figure is a schematic representation of the calcium morphologies, microcalcifications which is thought to be the beginning of the calcification cascade, spotty calcification, which is associated with high risk of events, large calcification which is thought to be more stable and dense calcification.
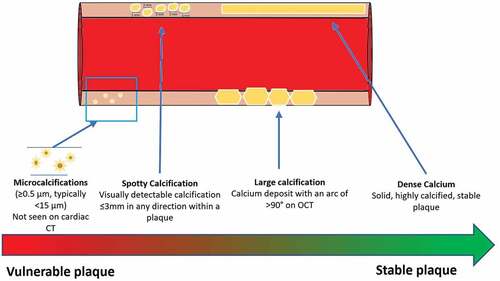
Table 1. This table describes the morphology of calcium and its significance.
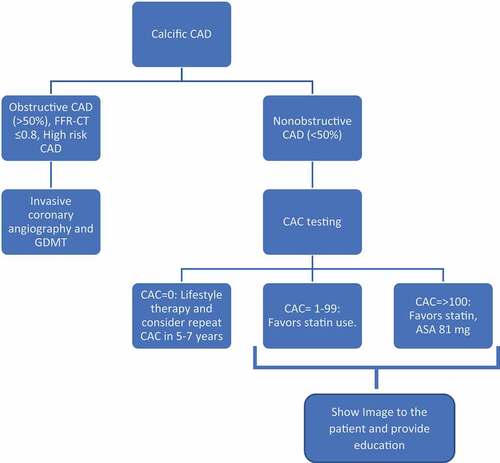
Figure 2. Suggested algorithm for calcific CAD. The presence of calcium in CAD can display different morphologies with different risk profiles, however, its only presence represents risk, thus, we suggest for nonobstructive CAD to go together with CAC score for better risk management.