
Figures & data
Figure 1. Estimated incidence of the common congenital heart diseases per 1,000 live births (indicated in parentheses)4.
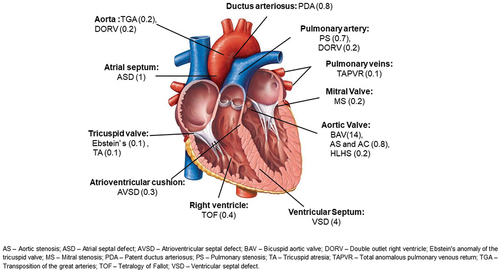
Table 1. Gene defects causing CHD (the ones that are known till now, the list with keep changing as new gene linkages are found).
Table 2. Risk of CHD in offspring of mothers with CHD according to different diseases.
Table 3. Modified WHO (m WHO) risk stratification classification.
Table 4. Predictors of adverse maternal cardiovascular events during pregnancy.
Figure 2. Hemodynamic changes during pregnancy.
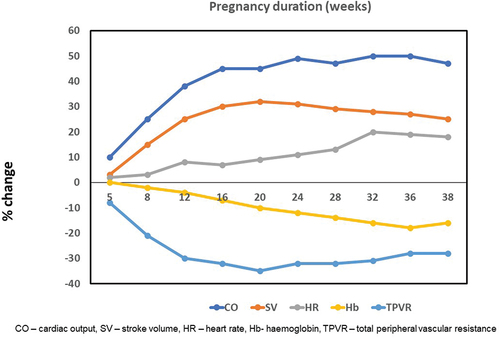
Figure 3. Changes in blood flow in pelvic blood vessels during pregnancy compared to non-pregnant state.
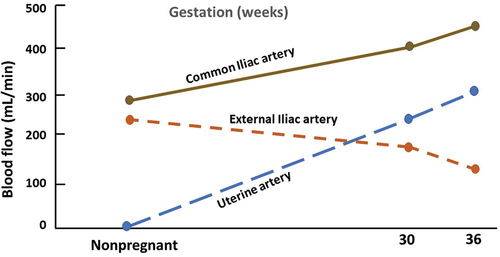
Figure 4. Graphs depicting release of anti-angiogenic factor soluble fms-like tyrosine kinase-1 (sFlt1) and soluble endoglin (eEng) and proangiogenic placental growth factor (PlGF)23.
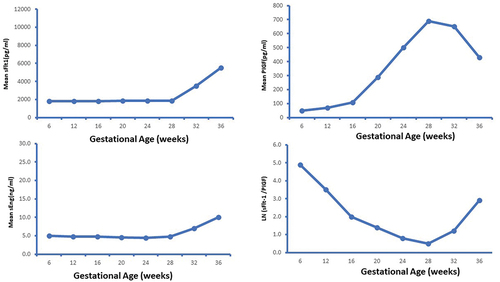
Figure 5. Schematic representation of management issues in pregnant women with aortic stenosis.
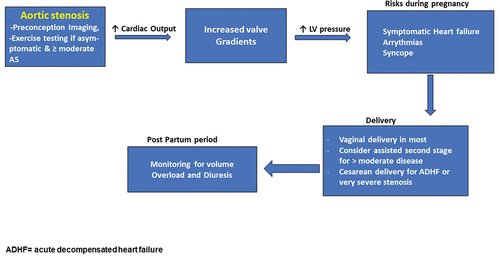
Table 5. Delivery planning in women with CHD.