Figures & data
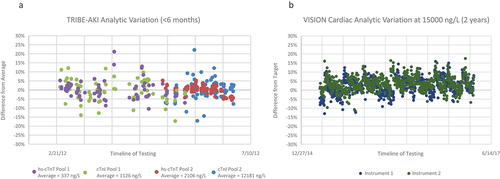
Figure 1. The percent difference between quality control (QC) results from the average for the plasma pools used in the TRIBE-AKI study for the Beckman cTnI (non-hs-cTnI assay) and Roche hs-cTnT assays (a) and from the target manufacturer QC concentration for the Abbott hs-cTnI assay on two different instruments used in the VISION cardiac surgery study (b).