
Figures & data
Table 1. Belgian Sample, Euregio Maas-Rhine, Flash EB 422.
Figure 1. Cross-border activities of Belgium respondents in the Euregio Maas-Rhine in 2015, N = 290 (share of respondents).
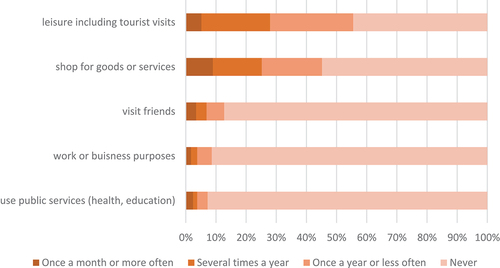
Table 2. Logistic regression on ‘living in a cross-border region’ (0 = has no impact, 1 = is more of an opportunity N = 240).