
Figures & data
Figure 1. Theoretical framework.
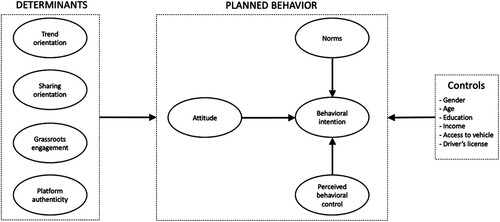
Table 1. Measurement items of the constructs.
Table 2. Sample demographics.
Table 3. Measurement model: reliability and validity.
Figure 2. Path estimates and statistical significance.
Note: *** p < 0.001; ** p < 0.01; * p < 0.05 (two-tailed); dotted paths illustrate non-statistically significant relationships. The percentage of explained variance (i.e. R2) can be considered substantial for behavioural intention to use the CG (51.91%), moderate for attitude towards the CG (35.85%) and norms (48%), and weak for perceived behavioural control (23.39%). The Q2predict values (obtained from the PLSpredict procedure) indicate that the model has high predictive relevance (see also Appendix 3).
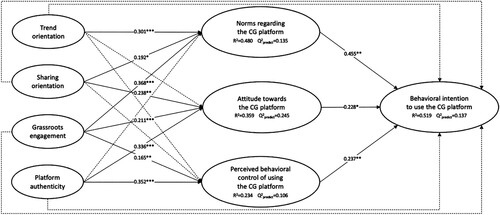
Table 4. Structural model (path analysis).