Figures & data
Figure 1. Procedure to generate different joint defects and investigate their mechanical behaviour under two different scenarios. (a) Three cells of a regular hexagonal honeycomb, where a single joint in the centre is perturbed by shifting the position of its junction point, P, inside a given T-shaped region (gray area). The size of this region is given in terms of the lattice dimension, a. The rectangular shape of this region is chosen for convenience. (b) The geometry of a joint characterized generally by eight geometrical parameters. (c) Periodic irregular honeycomb lattice built up in a unique way by identical copies of the joint of . (d) The joint is introduced as a defect in an otherwise regular hexagonal honeycomb.
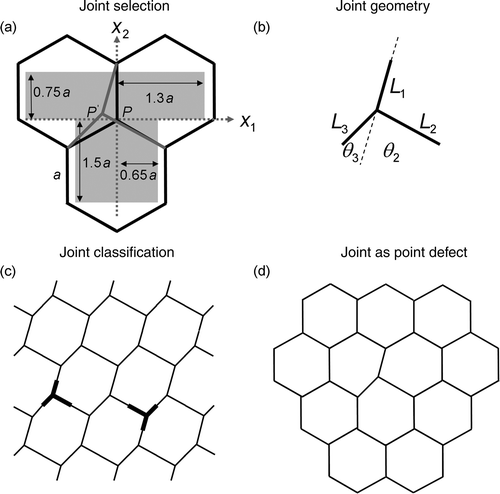
Figure 2. Contour plots of the strain energy density (SED) for different irregular periodic honeycombs, renormalised to have the same relative density, under uniaxial horizontal (a), vertical (b) and hydrostatic (c) compression. Each coloured pixel in the plot represents a honeycomb of different geometry as defined in the text and . The SED is normalised by the energy density of the regular hexagonal honeycomb, SED0.
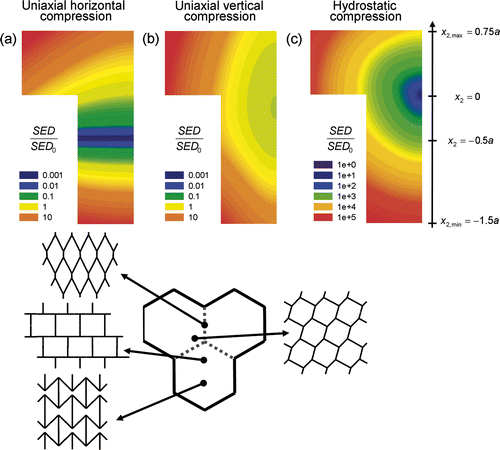
Figure 3. Total strain energy density of the regular honeycomb with defect (a) and the irregular periodic honeycomb (b) constructed with the defect joint following the procedure of . The x 2 coordinate of the junction point of the joint suffices to characterise the defect (plotted on the x-axis), since only joints with left-right-symmetry are considered. The three different loading cases of uniaxial horizontal, uniaxial vertical and hydrostatic compression are shown with full, dashed and full grey lines, respectively.
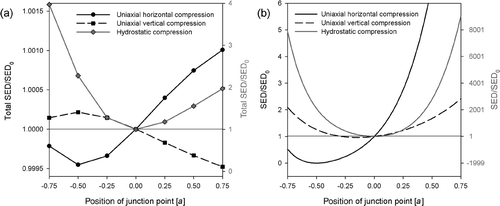
Figure 4. Spatial pattern of the strain energy density around a central defect in a regular hexagonal honeycomb under hydrostatic (a) and uniaxial vertical (b) compression. The arrow-shaped joint creating the defect is sketched between the two plots. The colour of each rectangular patch corresponds to the SED absorbed in that particular joint. Only a sub-region of the simulated lattice around the defect is shown. Again, the SED is normalised by the value for the regular honeycomb, SED0, which corresponds approximately to the energy density of joints far away from the defect.
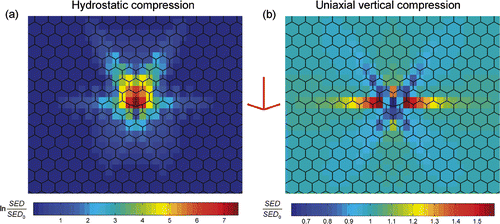
Figure 5. Strain energy density (SED) of the defect joint (circles) within a regular honeycomb under hydrostatic (a) and uniaxial (b) compression. The x 2 coordinate of the junction point of the joint suffices to characterise the defect (plotted on the x-axis), since only joints with left-right symmetry are considered. The SED of the defect joint is compared with the maximum value of the SED within the lattice (squares) and the analytical result of the SED for the irregular periodic honeycomb constructed with the defect joint (full line).
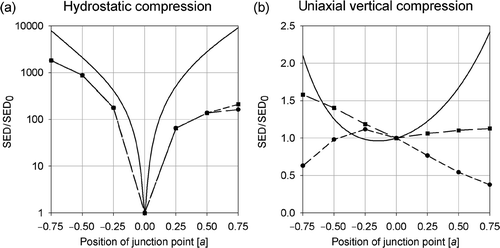
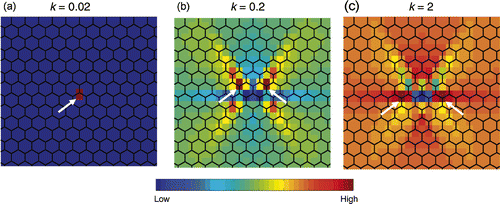
Figure 6. Spatial pattern of the strain energy density (SED) around a central defect in a regular hexagonal honeycomb under uniaxial vertical compression. The defect joint has unchanged geometry with respect to the regular honeycomb, but its beams have a cross-sectional radius changed by a factor k. Three different such mass defects are plotted corresponding to a very thin (a), a thin (b) and a thick defect joint (c) compared to the dimensions of the other beams. White arrows indicate the sites of maximum SED.