Figures & data
Table 1. Alloying-element contents and light element impurity contents in the binary iron-based Fe–Si alloy and the ternary Fe–Me–Si alloys prepared and employed in the present work.
Figure 1. (colour online) (a) Nitrogen content as a function of nitriding time for the binary Fe–2.0Si alloy and the ternary Fe–Me–2.0Si alloy (with Me = Ti, Cr and V) specimens nitrided at 580 °C with r
N = 0.1 atm−1/2. The “theoretical nitrogen contents” as indicated with dashed lines, pertain to (pure) ferrite saturation with nitrogen and all alloying-element atoms precipitated as stoichiometric MeN and Si3N4. (b) For nitriding times shorter than 30 h the nitrogen–content curves attain, except of the nitrided ternary Fe-0.2/0.5Ti–2.0Si alloy specimens, a practically constant nitrogen level. The dashed lines indicate the nitrogen levels in nitrided Fe–Me–2.0Si alloys for (pure) ferrite saturation ( = 0.29 at.%; according to [Citation50]) and all Me (= Ti, Cr and V) precipitated as stoichiometric MeN. The dotted lines in (a) and (b) are connecting the experimentally obtained data points.
![Figure 1. (colour online) (a) Nitrogen content as a function of nitriding time for the binary Fe–2.0Si alloy and the ternary Fe–Me–2.0Si alloy (with Me = Ti, Cr and V) specimens nitrided at 580 °C with r N = 0.1 atm−1/2. The “theoretical nitrogen contents” as indicated with dashed lines, pertain to (pure) ferrite saturation with nitrogen and all alloying-element atoms precipitated as stoichiometric MeN and Si3N4. (b) For nitriding times shorter than 30 h the nitrogen–content curves attain, except of the nitrided ternary Fe-0.2/0.5Ti–2.0Si alloy specimens, a practically constant nitrogen level. The dashed lines indicate the nitrogen levels in nitrided Fe–Me–2.0Si alloys for (pure) ferrite saturation ([N]α0 = 0.29 at.%; according to [Citation50]) and all Me (= Ti, Cr and V) precipitated as stoichiometric MeN. The dotted lines in (a) and (b) are connecting the experimentally obtained data points.](/cms/asset/9a146bc3-cb84-4fd2-99e1-332ef156dea4/tphm_a_952258_f0001_oc.gif)
Table 2. Predicted and measured ferrite-lattice parameters of the binary Fe–2.0Si alloy and the ternary Fe–Me–2.0Si alloys in the unnitrided state (stage 1).
Table 3. FWHM (in ° 2θ) of the 200α-Fe-ferrite peak (Kα1 component) of the binary Fe–2.0Si alloy and the ternary Fe–Me–2.0Si alloys in the unnitrided state (stage 1), after all Me has precipitated as MeN (stage 2) and after also all Si has precipitated as Si3N4 additionally to MeN (stage 3). The error in the FWHM values is ±0.013° 2θ (see Section 2.4).
Figure 2. (colour online) (a) Nitrogen content as a function of nitriding time for binary Fe-2.0Si alloy and ternary Fe–Me–2.0Si alloy (with Me = Ti, Cr and V) specimens nitrided at 580 °C with r N = 0.1 atm−1/2. The experimentally obtained data points were numerically fitted with a sigmoidal Boltzmann function (continuous lines). (b) The corresponding nitrogen-uptake rates as a function of nitriding time (derivatives of the continuous lines in (a)).
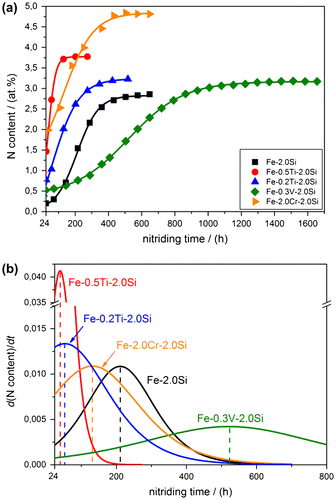
Figure 3. (colour online) TEM images recorded from ternary Fe–Me–Si alloy (with Me = Ti, Cr and V) specimens after nitriding at 580 °C with r
N = 0.1 atm−1/2 for 10 h in case of the Fe–0.2Ti–2.0Si alloy and for 24 h in case of the Fe–2.0Cr–2.0Si and Fe–0.3V–2.0Si alloys. The specimens show the development of nanosized MeN platelets (BF images (a1), (b1) and (c)). These platelets are associated with a coffee-bean-like contrast due to their (semi-) coherency with the surrounding ferrite matrix. The corresponding SADPs ([0 0 1]α-Fe-zone axis) show diffraction spots belonging to the ferrite matrix, iron oxide (-diffraction spots at the location of the forbidden 1 0 0α-Fe diffraction spot due to a surface-oxide layer which unavoidable develops upon TEM specimen preparation; see also Section 2.5 in Ref. [Citation70]) and in case of the Fe–2.0Cr–2.0Si and Fe–0.3V–2.0Si alloy specimens streaking along [1 0 0]α and [0 1 0]α directions. Further, in the SADP of the Fe–2.0Cr–2.0Si alloy specimen intensity maxima at the position of rock-salt type CrN diffraction spots, in compliance with a Baker–Nutting OR with respect to the ferrite matrix, are visible. Both, the BF images of the Fe–0.2Ti–2.0Si alloy specimen and the Fe–2.0Cr–2.0Si alloy specimen show, in addition to TiN/CrN platelets, cubical Si3N4 particles (see BF images (a2) and (b2)) in the ferrite matrix. The BF image of the Fe–0.2Ti–2.0Si alloy specimen (b2) shows additionally a ferrite-grain boundary covered with a band of amorphous Si3N4 (black line from top to bottom).
![Figure 3. (colour online) TEM images recorded from ternary Fe–Me–Si alloy (with Me = Ti, Cr and V) specimens after nitriding at 580 °C with r N = 0.1 atm−1/2 for 10 h in case of the Fe–0.2Ti–2.0Si alloy and for 24 h in case of the Fe–2.0Cr–2.0Si and Fe–0.3V–2.0Si alloys. The specimens show the development of nanosized MeN platelets (BF images (a1), (b1) and (c)). These platelets are associated with a coffee-bean-like contrast due to their (semi-) coherency with the surrounding ferrite matrix. The corresponding SADPs ([0 0 1]α-Fe-zone axis) show diffraction spots belonging to the ferrite matrix, iron oxide (220Fe3O4-diffraction spots at the location of the forbidden 1 0 0α-Fe diffraction spot due to a surface-oxide layer which unavoidable develops upon TEM specimen preparation; see also Section 2.5 in Ref. [Citation70]) and in case of the Fe–2.0Cr–2.0Si and Fe–0.3V–2.0Si alloy specimens streaking along [1 0 0]α and [0 1 0]α directions. Further, in the SADP of the Fe–2.0Cr–2.0Si alloy specimen intensity maxima at the position of rock-salt type CrN diffraction spots, in compliance with a Baker–Nutting OR with respect to the ferrite matrix, are visible. Both, the BF images of the Fe–0.2Ti–2.0Si alloy specimen and the Fe–2.0Cr–2.0Si alloy specimen show, in addition to TiN/CrN platelets, cubical Si3N4 particles (see BF images (a2) and (b2)) in the ferrite matrix. The BF image of the Fe–0.2Ti–2.0Si alloy specimen (b2) shows additionally a ferrite-grain boundary covered with a band of amorphous Si3N4 (black line from top to bottom).](/cms/asset/069c25a6-4a86-432f-b813-e979deeeff95/tphm_a_952258_f0003_oc.gif)
Figure 4. TEM images recorded from the ternary Fe–0.5Ti–2.0Si alloy specimen after nitriding at 580 °C with r
N = 0.1 atm−1/2 for 77 h (after this nitriding time all TiN and nearly all Si3N4 have precipitated). (a) BF image showing two cubical Si3N4 particles at the edge of the TEM foil; tiny (TiN) platelets can be discerned within these Si3N4 particles. (b) The corresponding SADP ([0 0 1] α-Fe-zone axis) with diffraction spots of the ferrite matrix (α), iron oxide (see caption of Figure ) and very weak streaks of intensities along [1 0 0]α and [0 1 0]α directions. (c) DF image recorded using the (weak) intensity of a streak (location of the aperture (at the position of the possible, but not observable, -diffraction spot) has been indicated with a dashed circle in the SADP) exhibits crystalline (TiN) platelets with a pronounced bright contrast in the ferrite matrix and within the cubical Si3N4 particles. The cubical Si3N4 particles appear also brighter than the surrounding matrix due to the diffuse intensity resulting from electron scattering by the amorphous Si3N4 particles. (d) DF image, recorded using the diffuse intensity, showing the Si3N4 particles by bright contrast with the matrix. Note the high Si3N4-particle density at this practically end stage of the precipitation process.
![Figure 4. TEM images recorded from the ternary Fe–0.5Ti–2.0Si alloy specimen after nitriding at 580 °C with r N = 0.1 atm−1/2 for 77 h (after this nitriding time all TiN and nearly all Si3N4 have precipitated). (a) BF image showing two cubical Si3N4 particles at the edge of the TEM foil; tiny (TiN) platelets can be discerned within these Si3N4 particles. (b) The corresponding SADP ([0 0 1] α-Fe-zone axis) with diffraction spots of the ferrite matrix (α), iron oxide (see caption of Figure 3) and very weak streaks of intensities along [1 0 0]α and [0 1 0]α directions. (c) DF image recorded using the (weak) intensity of a streak (location of the aperture (at the position of the possible, but not observable, 002¯TiN-diffraction spot) has been indicated with a dashed circle in the SADP) exhibits crystalline (TiN) platelets with a pronounced bright contrast in the ferrite matrix and within the cubical Si3N4 particles. The cubical Si3N4 particles appear also brighter than the surrounding matrix due to the diffuse intensity resulting from electron scattering by the amorphous Si3N4 particles. (d) DF image, recorded using the diffuse intensity, showing the Si3N4 particles by bright contrast with the matrix. Note the high Si3N4-particle density at this practically end stage of the precipitation process.](/cms/asset/65565600-f679-49d5-bde6-b7ae33c14d58/tphm_a_952258_f0004_b.gif)
Figure 5. TEM images recorded from the ternary Fe–2.0Cr–2.0Si alloy specimen after nitriding at 580 °C with r N = 0.1 atm−1/2 for 648 h (after this nitriding time all CrN and all Si3N4 have precipitated). In contrast with the electron transparent foils pertaining to the TEM analysis shown in Figures , and , this TEM foil was prepared from the core region (around 500 μm below the surface). (a) The BF image shows two cubical Si3N4 particles intersected by significantly coarsened (as compared to the initial stage: see Figure (b1)) CrN precipitates. (b) The corresponding SADP (with [0 0 1]α-Fe-zone axis) shows diffraction spots of the ferrite matrix (α), iron oxide (see caption of Figure ) and CrN of rock-salt crystal-structure type, satisfying a Baker–Nutting OR with respect to the ferritic matrix. (c) DF image, recorded using the diffuse intensity and a weak diffraction spot of CrN (see the large dashed circle in (b)), shows Si3N4 particles and CrN platelets with a pronounced bright contrast. (d) BF image showing two Si3N4 particles apparently nucleated at the tip of coarsened CrN platelets. (e) BF image showing Si3N4 particles grown along the faces of CrN platelets.
![Figure 5. TEM images recorded from the ternary Fe–2.0Cr–2.0Si alloy specimen after nitriding at 580 °C with r N = 0.1 atm−1/2 for 648 h (after this nitriding time all CrN and all Si3N4 have precipitated). In contrast with the electron transparent foils pertaining to the TEM analysis shown in Figures 3, 4 and 6, this TEM foil was prepared from the core region (around 500 μm below the surface). (a) The BF image shows two cubical Si3N4 particles intersected by significantly coarsened (as compared to the initial stage: see Figure 3(b1)) CrN precipitates. (b) The corresponding SADP (with [0 0 1]α-Fe-zone axis) shows diffraction spots of the ferrite matrix (α), iron oxide (see caption of Figure 3) and CrN of rock-salt crystal-structure type, satisfying a Baker–Nutting OR with respect to the ferritic matrix. (c) DF image, recorded using the diffuse intensity and a weak diffraction spot of CrN (see the large dashed circle in (b)), shows Si3N4 particles and CrN platelets with a pronounced bright contrast. (d) BF image showing two Si3N4 particles apparently nucleated at the tip of coarsened CrN platelets. (e) BF image showing Si3N4 particles grown along the faces of CrN platelets.](/cms/asset/c8be3920-bc53-4654-b29f-733407e570ba/tphm_a_952258_f0005_b.gif)
Figure 6. TEM images recorded from the ternary Fe–0.3V–2.0Si alloy specimen after nitriding at 580 °C with r N = 0.1 atm−1/2 for 1656 h (after this nitriding time all VN and all Si3N4 have precipitated). (a) BF image showing a cut through an octapod-shaped Si3N4 precipitate, with cross-over distance from tip to tip of approximately 350 nm; note the VN platelets within the Si3N4 particle. (b) The corresponding SADP ([0 1 1]α-Fe-zone axis) shows diffraction spots belonging to the ferrite matrix and VN and a diffuse intensity (“halo”) around the primary electron beam due to electron scattering by the amorphous Si3N4 precipitates. (c) DF image, recorded using the intensity of the 002VN-diffraction spot, exhibiting crystalline (VN) platelets with a pronounced bright contrast in the ferrite matrix and within the cubical Si3N4 particle. The cubical Si3N4 particles appear also brighter than the surrounding matrix due to the diffuse intensity resulting from electron scattering by the amorphous Si3N4 particle. (d) DF image, recorded using the diffuse intensity, showing multiple illuminated Si3N4 particles by bright contrast with the matrix.
![Figure 6. TEM images recorded from the ternary Fe–0.3V–2.0Si alloy specimen after nitriding at 580 °C with r N = 0.1 atm−1/2 for 1656 h (after this nitriding time all VN and all Si3N4 have precipitated). (a) BF image showing a cut through an octapod-shaped Si3N4 precipitate, with cross-over distance from tip to tip of approximately 350 nm; note the VN platelets within the Si3N4 particle. (b) The corresponding SADP ([0 1 1]α-Fe-zone axis) shows diffraction spots belonging to the ferrite matrix and VN and a diffuse intensity (“halo”) around the primary electron beam due to electron scattering by the amorphous Si3N4 precipitates. (c) DF image, recorded using the intensity of the 002VN-diffraction spot, exhibiting crystalline (VN) platelets with a pronounced bright contrast in the ferrite matrix and within the cubical Si3N4 particle. The cubical Si3N4 particles appear also brighter than the surrounding matrix due to the diffuse intensity resulting from electron scattering by the amorphous Si3N4 particle. (d) DF image, recorded using the diffuse intensity, showing multiple illuminated Si3N4 particles by bright contrast with the matrix.](/cms/asset/1e9de908-9144-4072-a765-672bfda70839/tphm_a_952258_f0006_b.gif)
Figure 7. (colour online) X-ray diffractograms (normalized with respect to integrated intensity) in the diffraction-angle range of the 200α-Fe reflection recorded from the surface of the binary Fe–2.0Si alloy specimen and the ternary Fe–Me–Si alloy (with Me = Ti, Cr and V) specimens before nitriding and after nitriding at 580 °C with a nitriding potential of 0.1 atm%1/2 for times (i) after the 1 mm thick specimens have been (homogenously) through nitrided (cf. Section 2.2) and (ii) after in addition to MeN, practically all Si3N4 has precipitated. In the diffractograms only reflections belonging to ferrite are observed. The intensity data (circles) were fitted with asymmetrical (split) pseudo-Voigt functions for the Kα1 and Kα2 components (continuous lines; cf. Section 2.4).
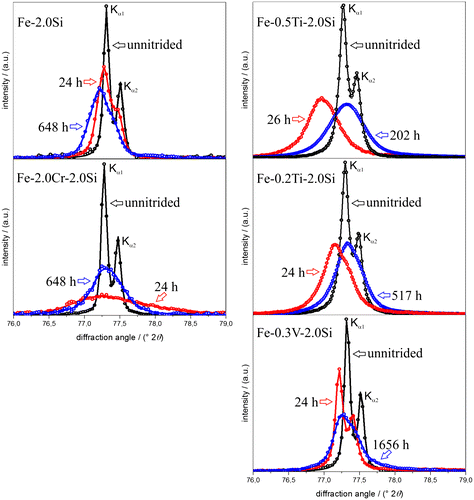
Table 4. Interaction parameter, I, defined as the ratio of the change of the chemical Gibbs energy upon precipitation of Me (with Me = Al, Ti, Cr, V and Si) and N, both dissolved in α-Fe (ferrite), as MeN
n
, at 773 K.  , where is the Gibbs energy of formation for one mole MeNn and is the Gibbs energy of dissolution of 1 mole nitrogen in ferrite (Fe–Me interaction is ignored). is the misfit-strain energy developing upon precipitation of MeN
n
in ferrite, where is the shear modulus of ferrite, C is given by 3/(3 + 4), with as the bulk modulus of MeN, ε is the linear misfit parameter and is the molar volume of the nitride. The misfit-strain energy was calculated according to Ref. [Citation24] for the case of full elastic accommodation of the misfit.
, where is the Gibbs energy of formation for one mole MeNn and is the Gibbs energy of dissolution of 1 mole nitrogen in ferrite (Fe–Me interaction is ignored). is the misfit-strain energy developing upon precipitation of MeN
n
in ferrite, where is the shear modulus of ferrite, C is given by 3/(3 + 4), with as the bulk modulus of MeN, ε is the linear misfit parameter and is the molar volume of the nitride. The misfit-strain energy was calculated according to Ref. [Citation24] for the case of full elastic accommodation of the misfit.
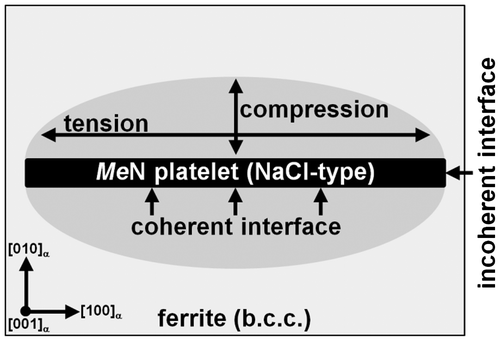
Figure 8. Schematic drawing of a (semi-) coherent MeN platelet in the ferrite matrix. Due to the (semi-)coherency of the misfitting MeN platelet, the ferrite matrix surrounding the platelet is tetragonally distorted: (i) Two principal tensile stresses act parallel to the platelet; and (ii) a principal compressive stress acts normal to the platelet.