Figures & data
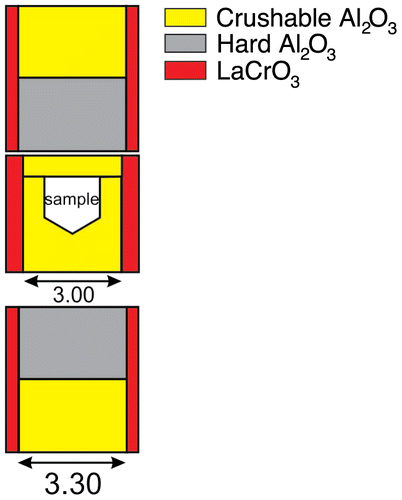
Figure 1. (colour online) Schematic cross section of cell assembly used for the present deformation experiments with the 18/11 assembly (unit: mm).

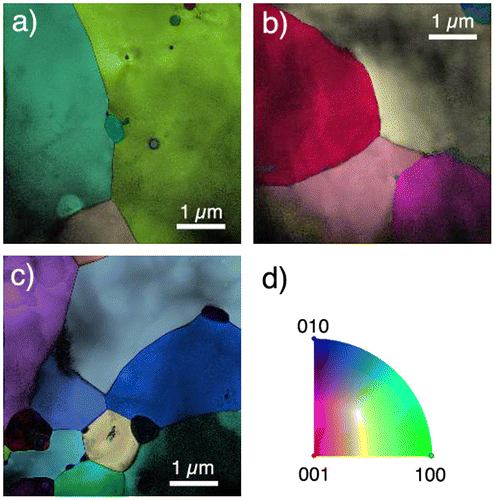
Figure 2. (colour online) Orientation maps (a–d). Each figure is a combination of the orientation map, of the virtual bright field and of the reliability. (a) Orientation map along z. (b–c) Orientation maps along y. (d) Colour code.

Table 1. Intensity (and dhkl) of the most intense reflections in Fe3C cementite (calculated with electron diffraction).
Figure 3. Sample DFC-3 – PED (precession angle 2°) on the grain imaged on Figures and . (a) [0 1 0] zone axis pattern. (b) [1 1 0] zone axis pattern. (c) [2 1 0] zone axis pattern. (d) [3 1 0] zone axis pattern. (e) Kikuchi map figuring the orientation sampled.
![Figure 3. Sample DFC-3 – PED (precession angle 2°) on the grain imaged on Figures 4 and 5. (a) [0 1 0] zone axis pattern. (b) [1 1 0] zone axis pattern. (c) [2 1 0] zone axis pattern. (d) [3 1 0] zone axis pattern. (e) Kikuchi map figuring the orientation sampled.](/cms/asset/c006e948-a379-4a6e-b8b0-6823634a5e1b/tphm_a_1177670_f0003_b.gif)
Figure 4. Sample DFC-2 – WBDF micrographs performed with: (a) g1: 002 close to the [1 2 0] zone axis. (b) Same area as (a) and same magnification. g2: -211 close to the [1 2 0] zone axis.
![Figure 4. Sample DFC-2 – WBDF micrographs performed with: (a) g1: 002 close to the [1 2 0] zone axis. (b) Same area as (a) and same magnification. g2: -211 close to the [1 2 0] zone axis.](/cms/asset/0bb801ef-c3d7-4a15-921f-bf35fc768064/tphm_a_1177670_f0004_b.gif)
Figure 5. Sample DFC-3 – WBDF micrographs performed with: (a) g1: -220 close to the [1 1 0] zone axis. (b) same area as (a). g2: -22-1 close to the [1 1 0] zone axis.
![Figure 5. Sample DFC-3 – WBDF micrographs performed with: (a) g1: -220 close to the [1 1 0] zone axis. (b) same area as (a). g2: -22-1 close to the [1 1 0] zone axis.](/cms/asset/a6b35192-ce6e-42d9-93de-e9286febcdff/tphm_a_1177670_f0005_b.gif)
Figure 6. Sample DFC-2 – WBDF micrographs performed with: g: 0 6 0 to look for possible evidences of [0 1 0] dislocations. No dislocation is found in contrast with g: 0 6 0 in any area investigated. The contrasts arrowed here are only residual contrasts related to [0 0 1] dislocations.
![Figure 6. Sample DFC-2 – WBDF micrographs performed with: g: 0 6 0 to look for possible evidences of [0 1 0] dislocations. No dislocation is found in contrast with g: 0 6 0 in any area investigated. The contrasts arrowed here are only residual contrasts related to [0 0 1] dislocations.](/cms/asset/ac2aa3e7-2126-489e-81d0-7a89a8e80f6a/tphm_a_1177670_f0006_b.gif)
Figure 7. Sample DFC-3 – Indexation of a [1 0 0] dislocation using the LACBED technique. (a) WBDF image with g: -22-1 showing the dislocation studied. (b) Experimental LACBED pattern crossing a dislocation (dotted arrow). The splittings of the Bragg lines can clearly be observed. (c) From the three identified splitting (with the -4-9-8, -204, 268 Bragg lines) the Burgers vector can be identified. Additional effects (not shown) with the -3-3-8, -4-6-1 Bragg lines have also been observed for this dislocation.
![Figure 7. Sample DFC-3 – Indexation of a [1 0 0] dislocation using the LACBED technique. (a) WBDF image with g: -22-1 showing the dislocation studied. (b) Experimental LACBED pattern crossing a dislocation (dotted arrow). The splittings of the Bragg lines can clearly be observed. (c) From the three identified splitting (with the -4-9-8, -204, 268 Bragg lines) the Burgers vector can be identified. Additional effects (not shown) with the -3-3-8, -4-6-1 Bragg lines have also been observed for this dislocation.](/cms/asset/7935e697-6dc4-4ac9-8eee-12124701c20c/tphm_a_1177670_f0007_b.gif)
Figure 8. Sample DFC-3 – Indexation of a [0 0 1] dislocation using the LACBED technique. (a) WBDF image with g: -22-1 showing the dislocation studied. (b) Experimental LACBED pattern. (c) Burgers vector determination resulting from the crossings with the 3 4 2, 4 5 2, 3 5 5, 5 6 2, 7 8 2 Bragg lines). The Burgers vector is identified.
![Figure 8. Sample DFC-3 – Indexation of a [0 0 1] dislocation using the LACBED technique. (a) WBDF image with g: -22-1 showing the dislocation studied. (b) Experimental LACBED pattern. (c) Burgers vector determination resulting from the crossings with the 3 4 2, 4 5 2, 3 5 5, 5 6 2, 7 8 2 Bragg lines). The Burgers vector is identified.](/cms/asset/41370d78-2b42-4944-98d9-0e58b8d4610e/tphm_a_1177670_f0008_b.gif)
Figure 9. Sample DFC-3 – [0 0 1] dislocation gliding in (1 0 0). (a) WBDF image with g: 2-21, obtained with the −36° tilt angle. The micrograph shows a straight [1 0 0] dislocation line and a highly curved [0 0 1] dislocation. (b) WBDF micrograph in the same diffraction condition as (a), projected with a tilt angle of 5°. The [0 0 1] dislocation is less curved than in (a). (c) WBDF image obtained with the same diffraction vector as (a) and (b), with a projected angle of 51°. The [0 0 1] dislocation appears as a straight line since its glide plane is edge-one. This plane corresponds to (1 0 0).
![Figure 9. Sample DFC-3 – [0 0 1] dislocation gliding in (1 0 0). (a) WBDF image with g: 2-21, obtained with the −36° tilt angle. The micrograph shows a straight [1 0 0] dislocation line and a highly curved [0 0 1] dislocation. (b) WBDF micrograph in the same diffraction condition as (a), projected with a tilt angle of 5°. The [0 0 1] dislocation is less curved than in (a). (c) WBDF image obtained with the same diffraction vector as (a) and (b), with a projected angle of 51°. The [0 0 1] dislocation appears as a straight line since its glide plane is edge-one. This plane corresponds to (1 0 0).](/cms/asset/5c2aa2a3-45f6-463b-bccd-3f66f82574b3/tphm_a_1177670_f0009_b.gif)
Figure 10. (colour online) Sample DFC-3 – [0 0 1] dislocation gliding in (0 1 0). (a) WBDF micrograph obtained with g: 2-21, tilt angle: −5°. (b) Corresponding reconstruction volume. (c) WBDF micrograph in the same diffraction conditions as (a), tilt angle: −37°. The [0 0 1] dislocation seems to have interacted with a small [0 0 1] dislocation loop. A black dashed line helps to distinguish the long [0 0 1] dislocation from the small loop. (d) Corresponding volume without the dislocation loop. (e) Reconstructed volume (tilt angle: −80°). The dislocation glide plane is edge-on and its trace corresponds to (0 1 0).
![Figure 10. (colour online) Sample DFC-3 – [0 0 1] dislocation gliding in (0 1 0). (a) WBDF micrograph obtained with g: 2-21, tilt angle: −5°. (b) Corresponding reconstruction volume. (c) WBDF micrograph in the same diffraction conditions as (a), tilt angle: −37°. The [0 0 1] dislocation seems to have interacted with a small [0 0 1] dislocation loop. A black dashed line helps to distinguish the long [0 0 1] dislocation from the small loop. (d) Corresponding volume without the dislocation loop. (e) Reconstructed volume (tilt angle: −80°). The dislocation glide plane is edge-on and its trace corresponds to (0 1 0).](/cms/asset/bef20bb4-987f-4d16-aaf2-e632f2d79ded/tphm_a_1177670_f0010_oc.gif)
Figure 11. Sample DFC-3 – Dissociated [1 0 0] dislocations. (a) Energy filtered WBDF micrographs with g: 2-20 (g.b = 1 with b = ½[1 0 0]); and beam precessed with an angle of 0.25° to remove the dislocation oscillating contrast and the thickness fringes contrast [Citation20,25]. The two ½[1 0 0] partial dislocations can clearly be seen. (b) WBDF micrograph with g: 1 0 2 (g.b = ½ with b = ½[1 0 0]). The stacking fault is in contrast while the partial dislocations are out of contrast with this diffraction condition.
![Figure 11. Sample DFC-3 – Dissociated [1 0 0] dislocations. (a) Energy filtered WBDF micrographs with g: 2-20 (g.b = 1 with b = ½[1 0 0]); and beam precessed with an angle of 0.25° to remove the dislocation oscillating contrast and the thickness fringes contrast [Citation20,25]. The two ½[1 0 0] partial dislocations can clearly be seen. (b) WBDF micrograph with g: 1 0 2 (g.b = ½ with b = ½[1 0 0]). The stacking fault is in contrast while the partial dislocations are out of contrast with this diffraction condition.](/cms/asset/3f25fd74-27fe-4895-b6cc-d4d92f5762a1/tphm_a_1177670_f0011_b.gif)
Figure 12. (colour online) Sample DFC-3 – Glide and dissociation plane of [1 0 0] dislocations. (a) experimental WBDF micrographs obtained using the 2-21 diffraction vector. The tilt angles are, respectively, 35°, 11°, −9°, −29° and −41°. The black arrow indicates the tilt angle range experimentally available in the microscope (between −61° and 51°). (b) 3D reconstruction volume projected along the directions as in (a) and also projected within the missing wedge (tilt angles are reported on the figures). The glide and dissociation planes of the [1 0 0] dislocations are edge-on along −80° and 100°. (c) Simulation of the Kikuchi lines (in kinematics conditions), between −80° and 100°, obtained with the Electron Diffraction software [Citation19]. The orientations of the Kikuchi lines of (0 1 0) correspond to the glide and dissociation plane trace of the [1 0 0] dislocations along −80° and 100° in (b) (red lines).
![Figure 12. (colour online) Sample DFC-3 – Glide and dissociation plane of [1 0 0] dislocations. (a) experimental WBDF micrographs obtained using the 2-21 diffraction vector. The tilt angles are, respectively, 35°, 11°, −9°, −29° and −41°. The black arrow indicates the tilt angle range experimentally available in the microscope (between −61° and 51°). (b) 3D reconstruction volume projected along the directions as in (a) and also projected within the missing wedge (tilt angles are reported on the figures). The glide and dissociation planes of the [1 0 0] dislocations are edge-on along −80° and 100°. (c) Simulation of the Kikuchi lines (in kinematics conditions), between −80° and 100°, obtained with the Electron Diffraction software [Citation19]. The orientations of the Kikuchi lines of (0 1 0) correspond to the glide and dissociation plane trace of the [1 0 0] dislocations along −80° and 100° in (b) (red lines).](/cms/asset/5aa3db6c-0f01-43ab-98e3-e3dee0207864/tphm_a_1177670_f0012_oc.gif)
