Figures & data
Table 1. Elastic tensor components at room temperature determined assuming different elastic tensor symmetries.
Table 2. Room temperature elastic moduli of Ti-6-4 from RUS experiments, alongside values published in the literature.
Figure 2. (colour online) Section of the RUS spectra collected around a single resonance peak showing the change of the resonance frequency with temperature between 11 and 292 K. Each spectrum is offset on the -axis in proportion to the temperature at which it was collected.
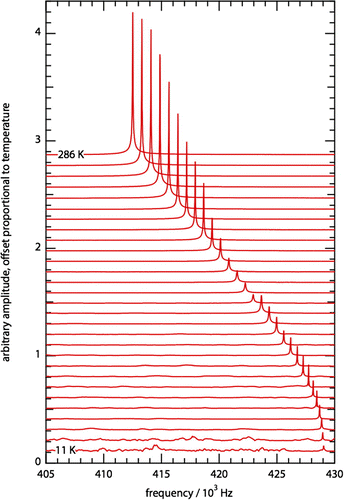
Figure 3. (colour online) The effect of temperature on (proportional to the effective modulus) and
(measure of acoustic dissipation) for two resonances.
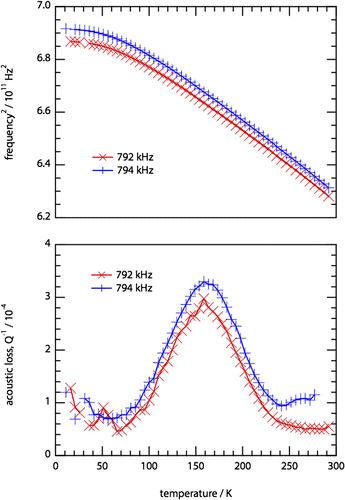
Figure 4. (colour online) Average Young’s (gold triangle markers), shear (green circle markers) and bulk (blue cross markers) moduli as a function of temperature between 10 and 298 K. The acoustic dissipation peak is also shown for reference (red ‘plus’ markers connected by a line). The experimental uncertainties in all of the measured values are smaller than the markers used.
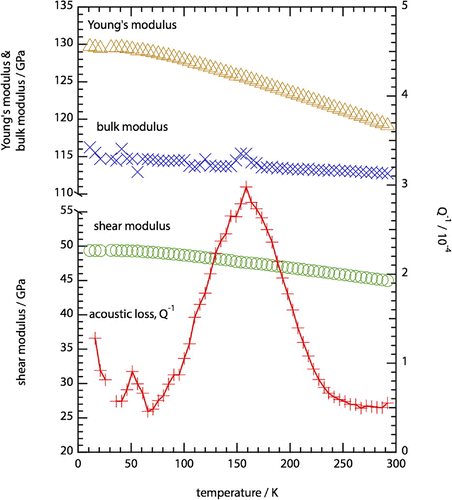
Figure 5. (colour online) Arrhenius plot showing against
, including literature values [Citation8–Citation11,Citation40].
![Figure 5. (colour online) Arrhenius plot showing against , including literature values [Citation8–Citation11,Citation40].](/cms/asset/b7a1ddd1-8dde-4aa3-8018-6b0441664a18/tphm_a_1198054_f0005_oc.gif)
Table 3. Activation energy and frequency factor obtained for the acoustic loss process investigated in this study. Literature values are also included for comparison.
Figure 6. (colour online) Behaviour of with inverse temperature for the resonance with frequency 412 kHz at 298 K. Two fits for Snoek-like behaviour, with
fixed at 23 kJ mol
are also shown. The result of the fit with the value of r
(
) fixed at 1 is shown with the dashed green line, whilst the solid blue line shows the result when r
(
) was allowed to vary.
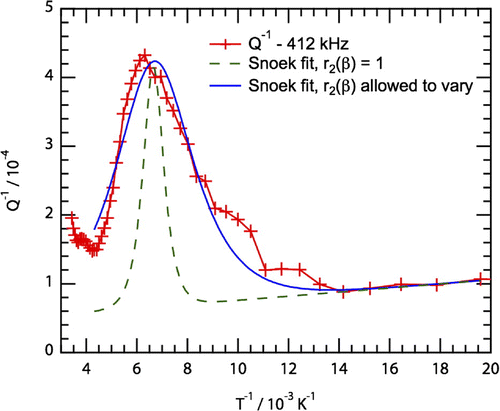
Figure 7. (colour online) A plot of against 1/
following Niblett [Citation50], including results from this study and the literature [Citation8–Citation10,Citation34]. The results (except [Citation34]) all lie on a line with zero gradient within error, suggesting that there is only one activation energy for the acoustic loss process.
![Figure 7. (colour online) A plot of against 1/ following Niblett [Citation50], including results from this study and the literature [Citation8–Citation10,Citation34]. The results (except [Citation34]) all lie on a line with zero gradient within error, suggesting that there is only one activation energy for the acoustic loss process.](/cms/asset/e323792a-60fd-4124-a74b-2c21ce62c439/tphm_a_1198054_f0007_oc.gif)

