Figures & data
Figure 1. Two-dimensional model of a metal single crystal with sinusoidal surface sheared by a platen that is subjected to a uniform distributed normal load . Dislocations (
) are nucleated from sources
homogeneously distributed in the bottom crystal, which contains also randomly distributed obstacles
.
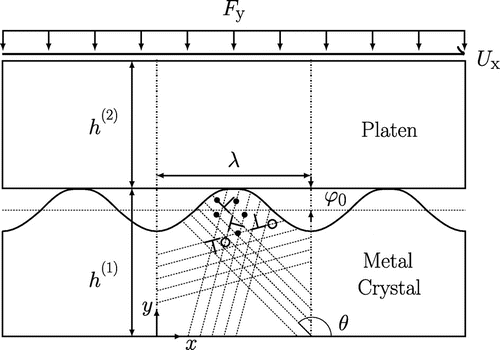
Figure 2. (colour online) (a) Deformed mesh plot for a body with height at
. Two identical unit cells are presented to show clearly the region where plasticity occurs. Displacements in the x direction are magnified 30 times. (b) Corresponding plastic strain distribution at the same
.
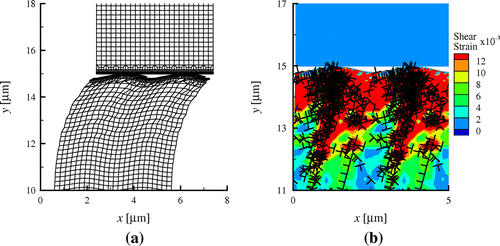
Figure 3. (colour online) Tangential force against displacement
for bodies with two different heights.
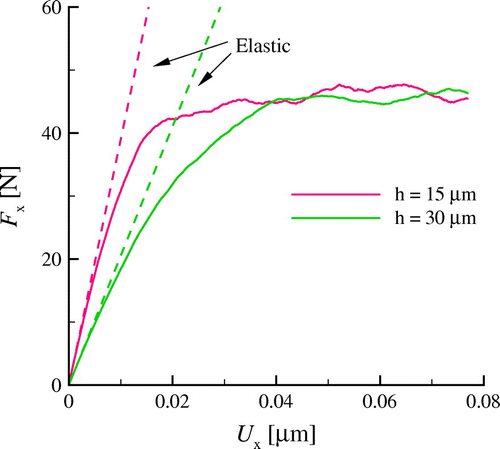
Figure 4. (colour online) Horizontal force against plastic displacement
for bodies with different properties. The force obtained from crystal plasticity is also included.
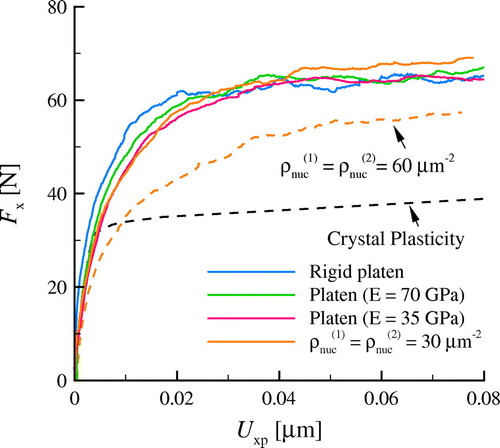
Figure 5. (colour online) Plastic strain distribution for shearing using an elastic platen with (a) and (b) shearing both bodies, each having a source density of
, at plastic displacement
for a particular realisation.
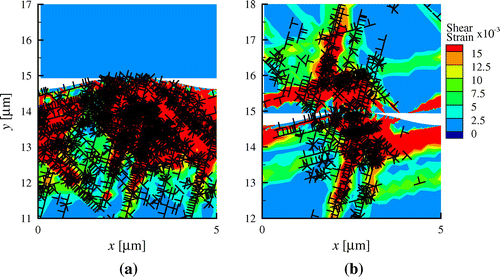
Figure 6. (colour online) (a) Tangential force of a truncated sinusoidal surface for different contact areas A. Each vertical bar corresponds to the standard deviation of eight simulations. Plastic shear strain and dislocation distributions for a particular realisation for
(b)
and (c)
at
.
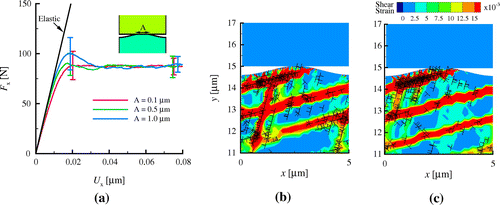
Figure 7. (colour online) Tangential force for different normal loads
applied on an area of
. Each vertical bar corresponds to the standard deviation of eight simulations.
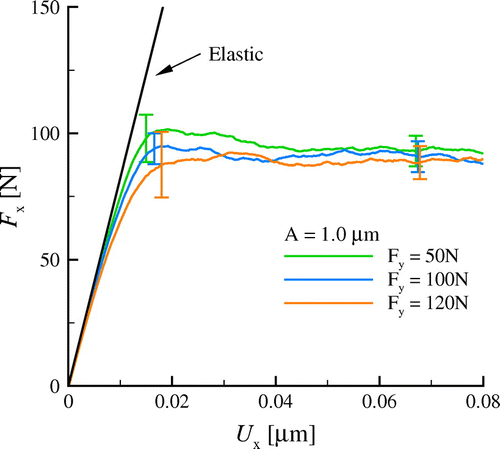
Figure 8. (colour online) (a) Normal displacement with normal force
. The dots represent the normal force the asperities are pre-loaded with, before they are sheared. (b) Tangential force
as a function of
.
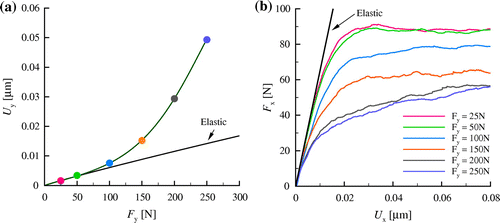
Figure 9. (colour online) Plastic strain distribution at when (a)
and (b)
, and at
when (c)
and (d)
.
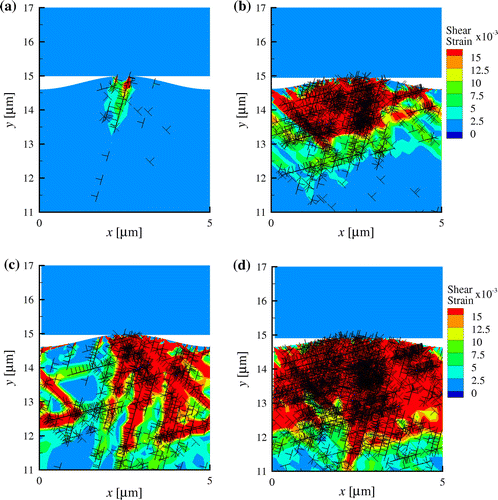
Figure 10. (colour online) Friction force and the corresponding friction coefficient
for the results shown in Figure (b).
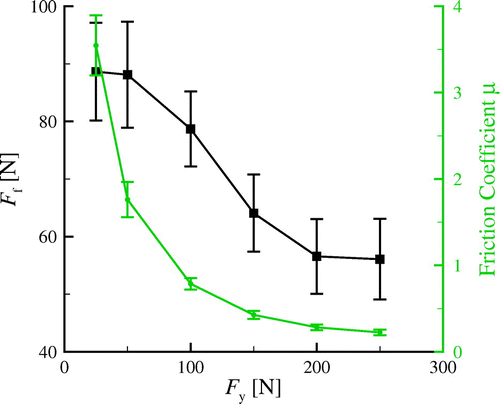
Figure 11. (colour online) (a) Contact traction distribution in the x and y directions for
at
for a particular realisation. (b) Corresponding contact profile: the y axis is stretched independently of the x axis, and (c) the ratio
. The average value of the friction coefficient is shown using a dashed line.
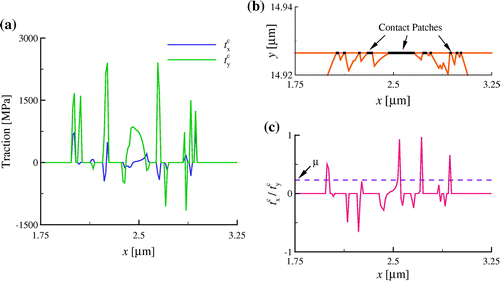
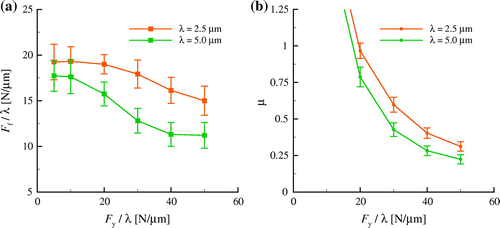
Figure 12. (colour online) (a) Friction force per unit wavelength , and (b) corresponding friction coefficient as a function of normal force per unit wavelength
for asperity wavelengths
and
. Each vertical bar corresponds to the standard deviation of eight simulations.