
Figures & data
Figure 1. Bright-field cross-sectional TEM image and indexed SAED pattern at the electrolyte side of the nc-Ni sample #FAC3 of the ED Ni series. The substrate side exhibited the same features.
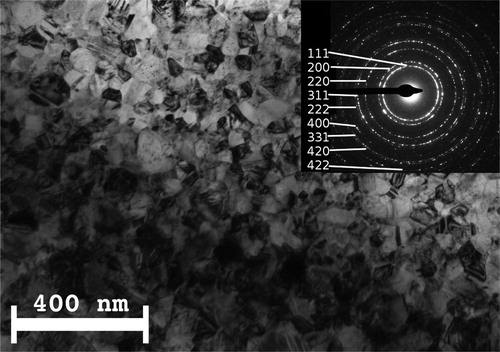
Figure 2. (a) Measured XRD pattern (open circles) recorded on the electrolyte side of the nc-Ni sample #FA3 of the ED Ni series and the fit curve from the eCMWP analysis (solid line); (b) TEM grain size histogram from the cross-sectional TEM image taken on the electrolyte side (see ) and fitted crystallite size distribution from the eCMWP analysis of the XRD pattern in (a) for the nc-Ni sample #FA3 of the ED Ni series.
Notes: (i) at such deposit thicknesses, XRD samples roughly half of the total thickness; (ii) both TEM and XRD exhibited the same features on both sides of the deposit for this sample.
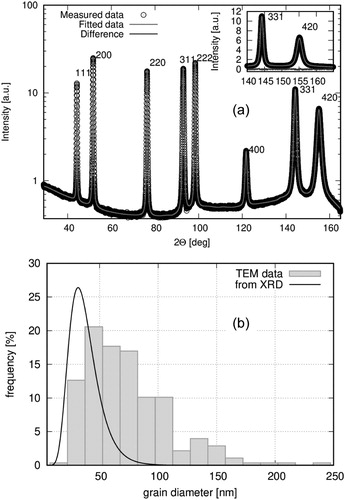
Table 1. Preparation details (electrodeposition bath and substrate), TEM grain size (d), XRD crystallite size (<x>) obtained from the eCMWP analysis and room-temperature resistivity (ρ) of the investigated ED nc-Ni foils.
Figure 3. Room-temperature resistivity ρ for all electrodeposited nc-Ni samples as a function of the TEM grain size d. Key to symbols: open circles (present data on the ED Ni series from ); open triangles (data from our previous works [21,30,31]); open squares [Citation13] and open diamonds [Citation32]. The thick solid line represents a fit to eq. (5) for all displayed TEM data with fixed ρbulk = 7.24 μΩcm and with the fitted value A = 14.7·10−16 Ωm2 (fit quality: R2 = 0.80).
![Figure 3. Room-temperature resistivity ρ for all electrodeposited nc-Ni samples as a function of the TEM grain size d. Key to symbols: open circles (present data on the ED Ni series from Table 1); open triangles (data from our previous works [21,30,31]); open squares [Citation13] and open diamonds [Citation32]. The thick solid line represents a fit to eq. (5) for all displayed TEM data with fixed ρbulk = 7.24 μΩcm and with the fitted value A = 14.7·10−16 Ωm2 (fit quality: R2 = 0.80).](/cms/asset/e30286db-f214-4dc5-a0ad-08731cabcba3/tphm_a_1580399_f0003_ob.jpg)
Figure 4. Room-temperature resistivity ρ for electrodeposited nc-Ni samples as a function of the XRD crystallite size <x>. Key to symbols: closed circles: present data on the ED Ni series from and on samples #B2 and #Ni(TKE); closed triangles [Citation14]; solid squares [Citation15]. The thick solid line is identical with that of (ρ vs. TEM grain size, from fit for all TEM-based data); the dash-dot line represents an approximate average over all displayed XRD data.
![Figure 4. Room-temperature resistivity ρ for electrodeposited nc-Ni samples as a function of the XRD crystallite size <x>. Key to symbols: closed circles: present data on the ED Ni series from Table 1 and on samples #B2 and #Ni(TKE); closed triangles [Citation14]; solid squares [Citation15]. The thick solid line is identical with that of Figure 4 (ρ vs. TEM grain size, from fit for all TEM-based data); the dash-dot line represents an approximate average over all displayed XRD data.](/cms/asset/da98f0ec-13e1-4afb-9ea5-589665a2256a/tphm_a_1580399_f0004_ob.jpg)
Figure 5. Temperature dependence of the resistivity ρ of Ni metal in the solid fcc phase [Citation27] and in the liquid state as well as the extrapolation of the liquid-state data to 300 K from Refs. Citation45–48. Tc: Curie point; Tm: melting point.
![Figure 5. Temperature dependence of the resistivity ρ of Ni metal in the solid fcc phase [Citation27] and in the liquid state as well as the extrapolation of the liquid-state data to 300 K from Refs. Citation45–48. Tc: Curie point; Tm: melting point.](/cms/asset/b05d3a81-7894-4121-8059-a190c3ac3279/tphm_a_1580399_f0005_ob.jpg)