Figures & data
Figure 1. Comparison between experimentally measured points taken from the material processed by SPD [Citation4] (symbols) and interpolated experimental data from Frary and Schuh [Citation22] (lines) for the fractions of different TJ types with a manifestation of micro-inhomogeneity phenomena.
![Figure 1. Comparison between experimentally measured points taken from the material processed by SPD [Citation4] (symbols) and interpolated experimental data from Frary and Schuh [Citation22] (lines) for the fractions of different TJ types with a manifestation of micro-inhomogeneity phenomena.](/cms/asset/64620181-ab49-4067-b900-c429c275f5b0/tphm_a_1695071_f0001_oc.jpg)
Figure 2. Schematic of the main triple junction types Ji with transitions due to change of one incident boundary from LAGB (L) to HAGB (H).
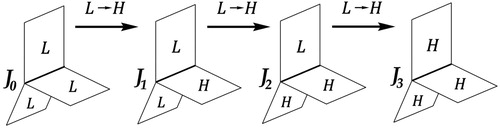
Figure 3. A discrete complex with 100 grains (a) and a couple of Voronoi cells (b) with their elements.
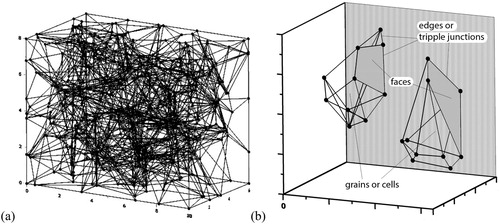
Figure 4. The average curve for experimental points [Citation26] and its theoretical fitting by the Equations (3) and (4) with parameters ,
and
,
,
respectively.
![Figure 4. The average curve for experimental points [Citation26] and its theoretical fitting by the Equations (3) and (4) with parameters A=2, B=0.9 and A=2, B=1.8, C=0.2 respectively.](/cms/asset/4cc81d5b-1405-4539-b4ac-b8c5c4698745/tphm_a_1695071_f0004_ob.jpg)
Figure 5. TJs fractions as functions of accumulated strain during SPD of copper alloys, obtained by discrete complex calculations (curves), calculations with random distribution of HAGBs (empty symbols), and with account for crystallographic constraints (filled symbols) [Citation22].
![Figure 5. TJs fractions as functions of accumulated strain during SPD of copper alloys, obtained by discrete complex calculations (curves), calculations with random distribution of HAGBs (empty symbols), and with account for crystallographic constraints (filled symbols) [Citation22].](/cms/asset/0552412f-835f-4c3c-af75-8a66e8bf49e8/tphm_a_1695071_f0005_ob.jpg)
Figure 6. The sketch of triple junction distribution in the small area of a grain with the same number of boundaries and different distribution of TJ types. Dotted grey lines represent LAGBs, while all bold lines are HAGBs. Localised mode of CDRX must generate much less TJs with the only adjacent HAGB ( type), than in any random process.
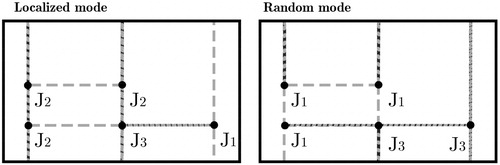
Figure 7. Calculation curves of TJs fractions with the discrete complex approach, obtained for (a) quasi-homogeneous distribution of TJs by Equation (9) and (b) including micro-inhomogeneity phenomena by Equation (11) with ,
. Experimental points have been taken from Morozova et al. [Citation4].
![Figure 7. Calculation curves of TJs fractions with the discrete complex approach, obtained for (a) quasi-homogeneous distribution of TJs by Equation (9) and (b) including micro-inhomogeneity phenomena by Equation (11) with λ1=3, λ2=4. Experimental points have been taken from Morozova et al. [Citation4].](/cms/asset/98b43f01-4598-43bc-bff8-037d5ffec58b/tphm_a_1695071_f0007_oc.jpg)
Figure 8. Calculation of TJs fractions with the discrete complex approach by Equation (8) with the constant values and
. Experimental points have been taken from Morozova et al. [Citation4].
![Figure 8. Calculation of TJs fractions with the discrete complex approach by Equation (8) with the constant values α1=1,α2=10 and α3=5. Experimental points have been taken from Morozova et al. [Citation4].](/cms/asset/0694e067-01b5-44b0-90da-8b0ec20dce82/tphm_a_1695071_f0008_oc.jpg)
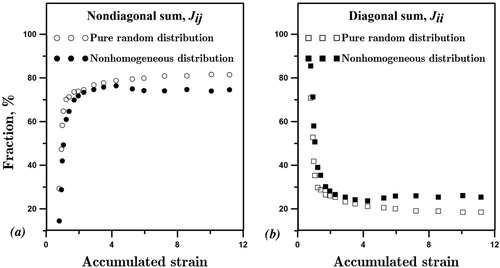
Figure 9. Purely random evolution of the TJs system and non-homogeneous evolution accounting micro-localisation processes. Sums of nondiagonal (a) and diagonal (b) components of the connectivity matrix.