Figures & data
Figure 1. A typical snapshot of a ‘crystalline’ system of particles by means of the Voronoi and the Delaunay diagrams. The enlarged picture in the insert facilitates the visualization of the constructions described in the text.
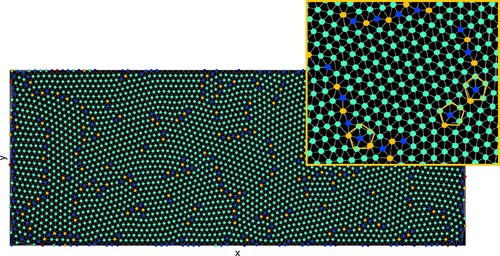
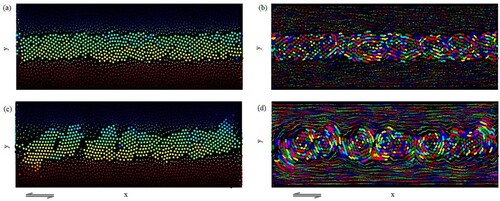
Figure 2. ‘Turbulent’ flow of a layer of a stiff material sandwiched between two layers of a softer, more compliant material. Shear deformation is imposed by the movement of the upper confining plate to the left, and he lower one to the right. (a) and (c) show the morphology of the stiff material for shear strains equal to 5 and 10 (in relative units), respectively. The width of each layer is taken to be unity. In these units, the length of the zone considered is 10. The particles comprising the stiff and the pliant materials are represented by large and small circles, respectively. The magnitude of the velocity along the horizontal axis is visualized in (a) and (c) using the colours of the standard ‘jet’ colour code, in which red corresponds to the largest and blue to the smallest magnitude of a variable. The ‘comet tails’ in the subplots (b) and (d) reproduce short traces of the individual trajectories of particles preceding the moment at which the shown snapshot was taken. Different colours in these two subplots are used just for better visual separation of the individual trajectories and do not represent any numerical characteristic of the particle motion.