
Figures & data
Figure 2. Computational results for the densest columnar sphere packings. Shown is the packing density Φ as a function of the ratio D/d of tube to sphere diameter, together with the phyllotactic notation of the structures (see [Citation27] for an extended range of D/d values). The shaded region of the diagram is of relevance to the soft sphere packings discussed in this article. Whenever the line-slip packings and
are not those of highest density their packing fraction is indicated by dotted lines (these are for illustrative purposes only and not the result of computation).
![Figure 2. Computational results for the densest columnar sphere packings. Shown is the packing density Φ as a function of the ratio D/d of tube to sphere diameter, together with the phyllotactic notation of the structures (see [Citation27] for an extended range of D/d values). The shaded region of the diagram is of relevance to the soft sphere packings discussed in this article. Whenever the line-slip packings (3,2,1) and (3,3,0) are not those of highest density their packing fraction is indicated by dotted lines (these are for illustrative purposes only and not the result of computation).](/cms/asset/8b6798ee-5555-45e2-b67c-ee6306c6a5ef/tphm_a_2208885_f0002_oc.jpg)
Figure 1. An example of a uniform (a) columnar structure and its line slip modification (b), generated by packing spheres of diameter d into a tube of diameter D. In the uniform structure, every sphere has an identical neighbourhood with a coordination number z = 6. Its corresponding line slip structure (shown to the right) is characterised by gaps (i.e. loss of contacts), highlighted by the (red) ellipse. For the structure classification we use the phyllotactic notation (see [Citation26, Citation27] for details).
![Figure 1. An example of a (4,4,0) uniform (a) columnar structure and its line slip modification (b), generated by packing spheres of diameter d into a tube of diameter D. In the uniform structure, every sphere has an identical neighbourhood with a coordination number z = 6. Its corresponding line slip structure (shown to the right) is characterised by gaps (i.e. loss of contacts), highlighted by the (red) ellipse. For the structure classification we use the phyllotactic notation (see [Citation26, Citation27] for details).](/cms/asset/b35261a3-6ba7-4ae3-a1f7-41d0889b07af/tphm_a_2208885_f0001_oc.jpg)
Figure 3. A schematic version of a part of the full phase diagram presented in [Citation29], showing the structure of minimal enthalpy structure. The horizontal axis (i.e. the pressure p = 0 (hard-sphere) limit) corresponds to the shaded part of . The red diamond indicates the value of D/d at which the uniform packing is found in the hard sphere limit. The regions of the phase diagram indicates which packing – either uniform structures (
) or line-slip (
) has the lowest enthalpy.
![Figure 3. A schematic version of a part of the full phase diagram presented in [Citation29], showing the structure of minimal enthalpy structure. The horizontal axis (i.e. the pressure p = 0 (hard-sphere) limit) corresponds to the shaded part of Figure 2. The red diamond indicates the value of D/d at which the uniform packing (4,2,2) is found in the hard sphere limit. The regions of the phase diagram indicates which packing – either uniform structures (U0,U1,U2) or line-slip (L0,L1,L2) has the lowest enthalpy.](/cms/asset/60c7be5f-bf52-4df9-98ad-b46162121b7b/tphm_a_2208885_f0003_oc.jpg)
Table 1. Critical pressures for reversible transitions.
Figure 4. Directed network displaying possible structural transitions between uniform structures, in the hard sphere limit. The structures are restricted to packings without internal spheres and are labelled using phyllotactic notation. The point represents a conceptual origin for the diagram, corresponding to
. Dashed lines are contours of constant D/d – a transition from one structure to another which involves moving along the diagram in a direction perpendicular to the contours implies a change in D/d. Favourable transitions are marked with blue arrows, unfavourable transitions with red arrows and all unstable cases are shown with black dashed arrows.
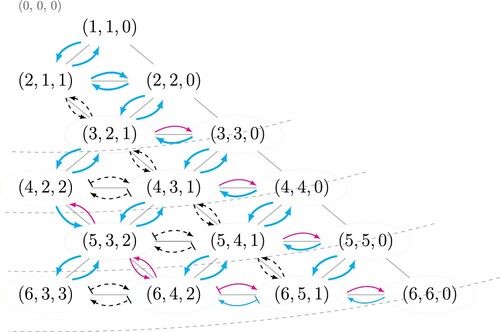
Figure 5. Schematic displaying the topological features of a stability diagram for reversible transitions. The two uniform arrangements are labelled by and
and the intermediate line slip is labelled LS. Solid lines represent discontinuous transitions, continuous transition are marked as dashed lines and the arrows at the lines indicate the direction of the transition. For this type of transition
transforms reversibly into
, showing only hysteresis above a threshold pressure
. (Taken from previous publication [Citation29])
![Figure 5. Schematic displaying the topological features of a stability diagram for reversible transitions. The two uniform arrangements are labelled by U1 and U2 and the intermediate line slip is labelled LS. Solid lines represent discontinuous transitions, continuous transition are marked as dashed lines and the arrows at the lines indicate the direction of the transition. For this type of transition U1 transforms reversibly into U2, showing only hysteresis above a threshold pressure p3. (Taken from previous publication [Citation29])](/cms/asset/acfe8ce4-41a9-46ac-8747-a15f6a446a94/tphm_a_2208885_f0005_oc.jpg)
Figure 6. Schematic stability diagrams for irreversible transitions. The uniform arrangements are labelled by ,
and
and the intervening line slip, in each case, is labelled LS. Solid lines represent discontinuous transitions, continuous transition are marked as dashed lines and the arrows at the lines indicate the direction of the transition. (a) Type I transition: Structure
is of the type
. (b) Type II transition: Structure
is of the type
.
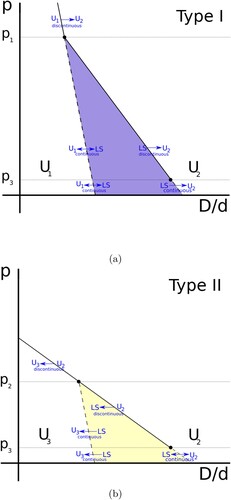
Table 2. Critical pressures for irreversible transitions.