
Figures & data
Figure 1. Correlations obtained from mechanical property data from micropillar compression experiments carried out on a range of bcc metals. a) The relationship between the power law exponent, n, and testing temperature as a fraction of the critical temperature for the onset of screw dislocation mobility, T* = T/Tc. b) The correlation between the power law exponent and the pre-exponential constant, A; the dotted lines are plots of equation 7 for different values of the intrinsic size exponent, n’, as defined in equation 3.
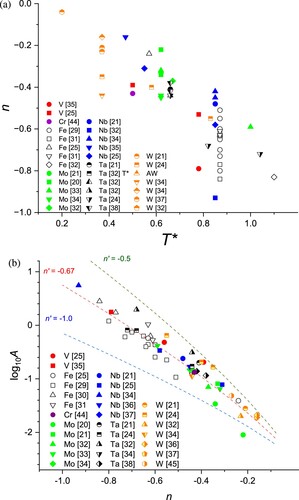
Figure 2. Influence of the mean flow stress value, , on equation 5 when compared with the data for bcc metal micropillar compression using n’ = −0.67 and A’ = 0.71.
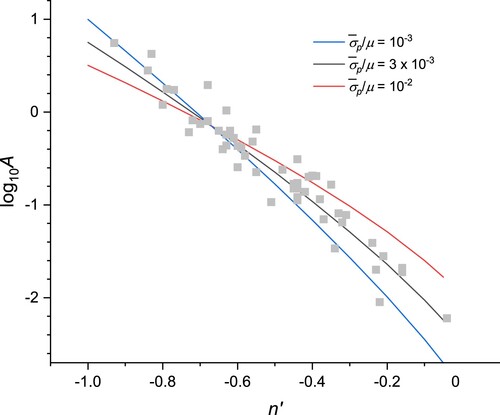
Figure 3. The correlation between the power law exponent, n, and the pre-exponential constant, A for materials with: a) The rock salt (NaCl) crystal structure; the bcc data from a is included for comparison. b) Semiconductors with structures based on diamond or related hexagonal structures (SiC is the 6H structure) with bcc and rock salt structures shown for reference. The dotted lines are plots of equation 7 for different values of the intrinsic size exponent, n’, with constants from .
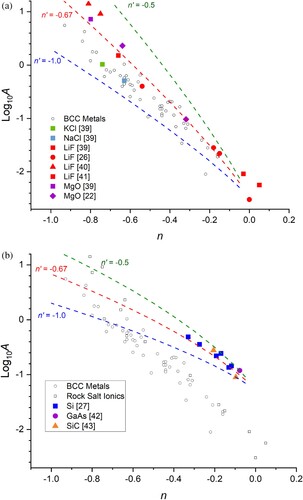
Table 1. Constants used in equation 7 to describe the correlation between the size effect exponent, n, and the pre-exponential constant, A.