Figures & data
Figure 1. The cross-sectional view of a PV/T air collector.
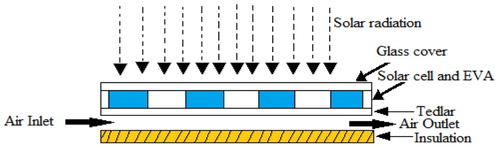
Figure 2. Air PV/T experimental device.
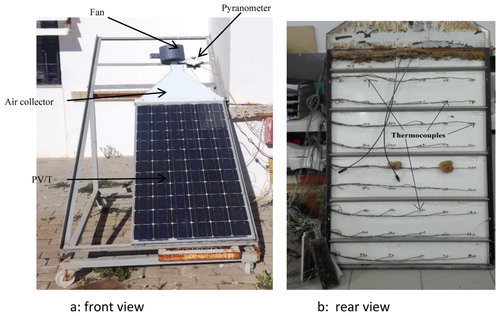
Table 1. Specifications of PV panel.
Table 2. Specifications of PV/T collectors.
Table 3. Uncertainty of measured variables.
Figure 3. Details the thermocouple positions in the PV/T collector.
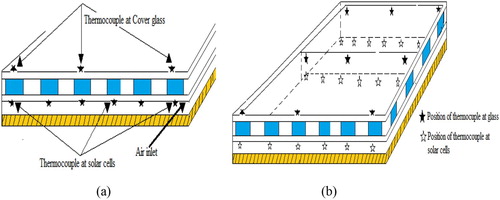
Figure 4. (a) Equivalent circuit of the single diode model of PV cell; (b) Theoretical I-V Characteristic of a PV cell.
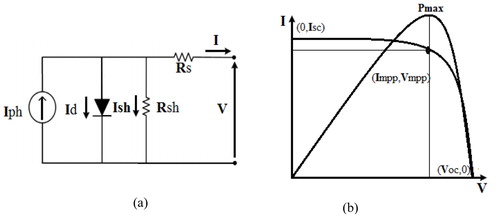
Figure 5. Schematic representation of thermal resistances in a hybrid air collector.
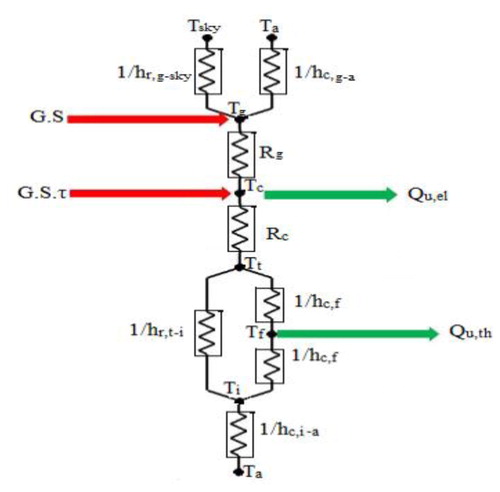
Figure 6. The simulated and experimental values of short-circuit current during the test day.
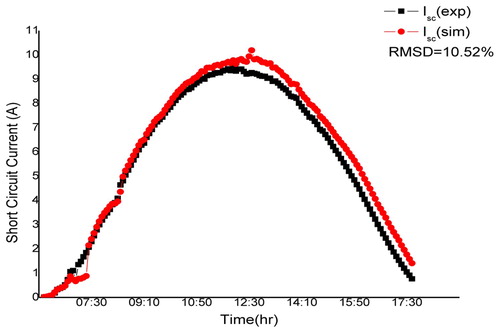
Figure 7. The simulated and experimental values of open-circuit voltage during the test day.
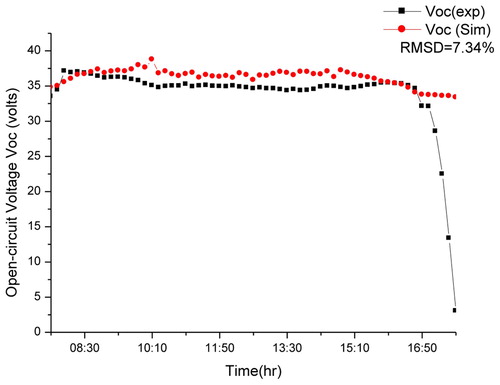
Figure 8. The simulated and predicted values of outlet air temperature and the corresponding experimentally measured data during the test day.
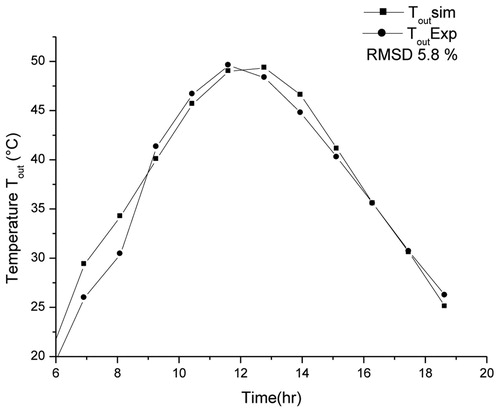
Figure 9. The simulated and predicted values of solar cell temperature and the corresponding experimentally measured data during the test day.
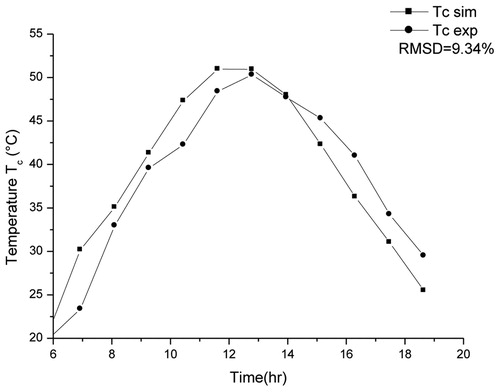
Figure 10. Variation short-circuit current and open -circuit voltage as a function of cell temperature and solar radiation.
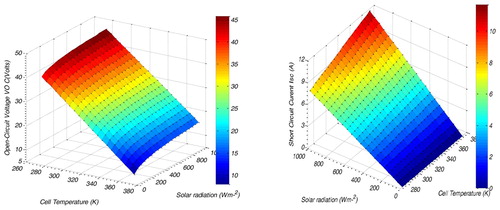
Figure 11. Variation maximum power as a function of cell temperature and solar radiation.
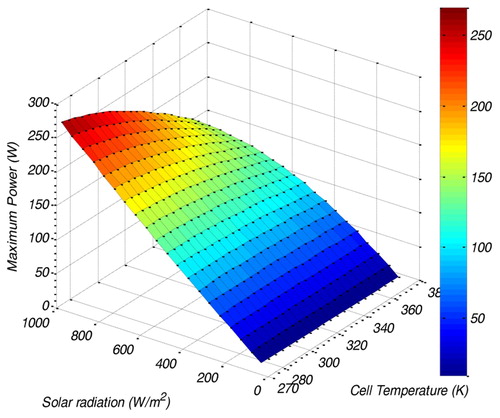
Figure 12. Evolution of thermal, electrical and overall efficiency, as a function of mass flow.
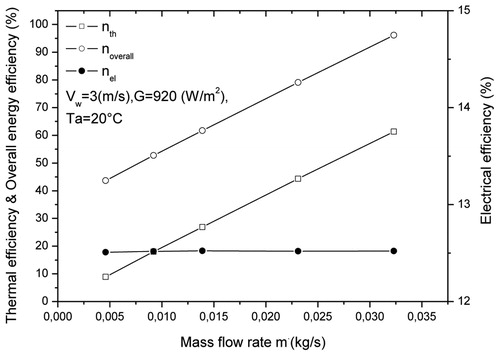
Figure 13. Evolution efficiencies as a function of time.
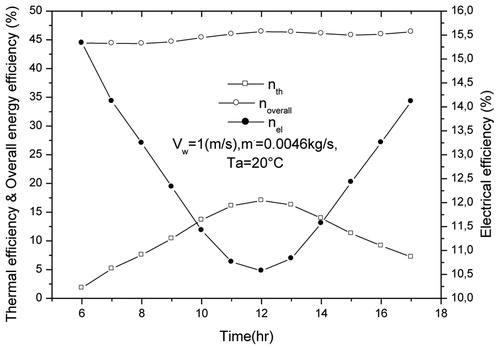
Figure 14. Evolution of thermal efficiency as a function of solar radiation.
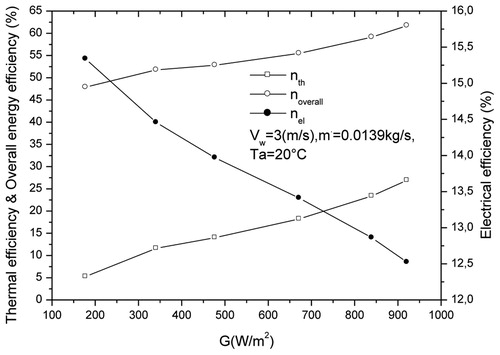
Figure 15. Evolution of thermal efficiency in wind speed.
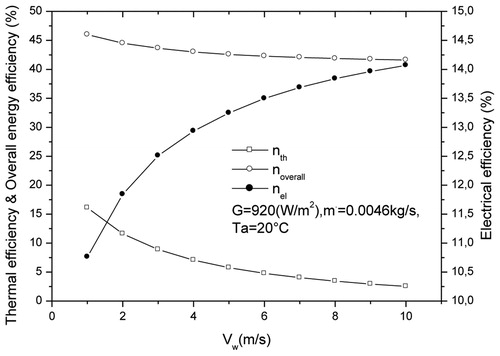
Figure 16. Evolution of thermal efficiency as a function of ambient temperature.
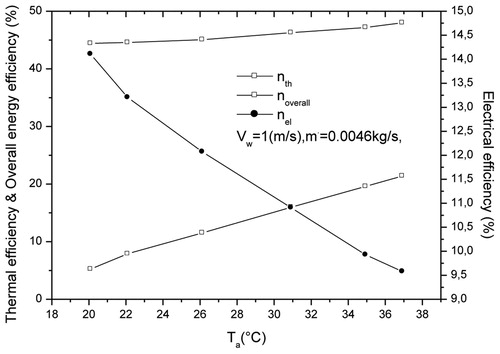
Table 4. The efficiencies of PV/T system for Tamb = 300 K, Vw = 1 m/s and G = 700 w/m2.
Figure 17. Sensitivity analysis of the rate of thermal energy output of the PV/T air system for different channel depth.
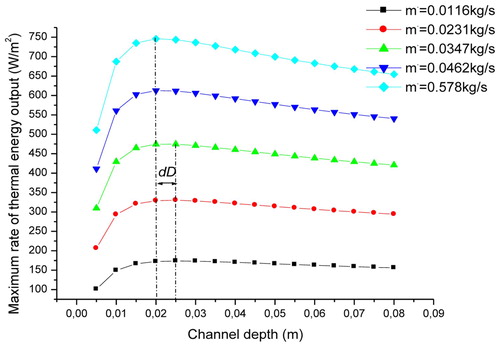
Table 5. Cost of the system components.
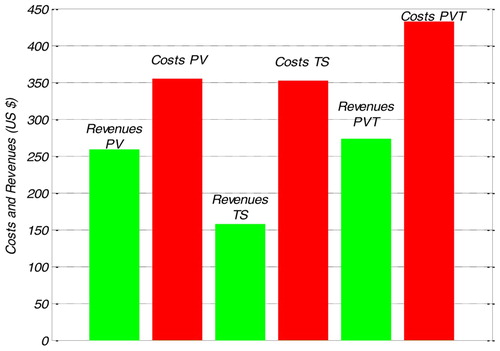
Figure 18. Costs and revenues.