
Figures & data
Figure 1. Repartition of olive oil production in Mediterranean countries in 2017.
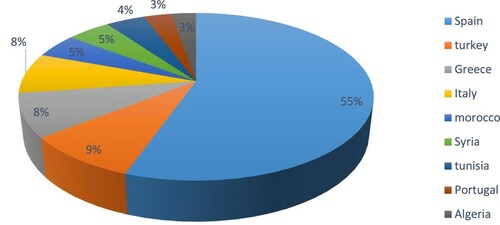
Figure 2. Location of Biomass and CHP sites (Google map Citation2020).
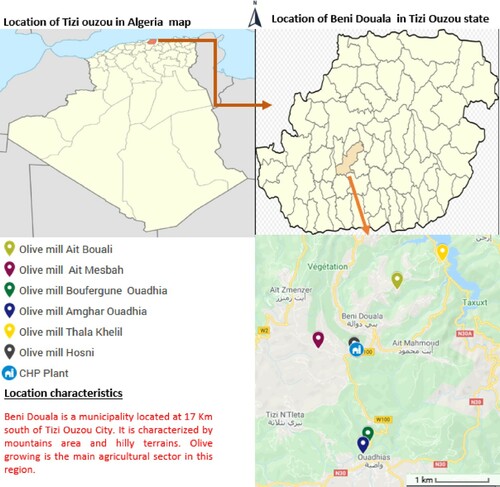
Table 1. Olive pomace generated in selected olive mills and their distance from the plant.
Table 2. Proximate and ultimate analysis of the biomass used (Fortunato et al. Citation2017; Vera et al. Citation2018a).
Figure 3. Schematic of the power plant.
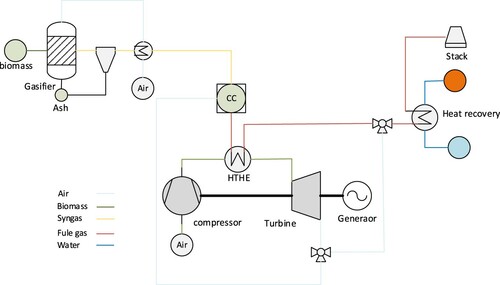
Figure 4. Calculations procedure developed by Cycle-Tempo®.
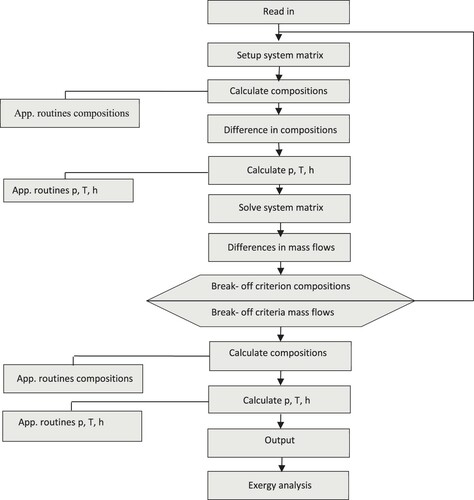
Figure 5. Schematic of the CHP system in Cycle-Tempo®.
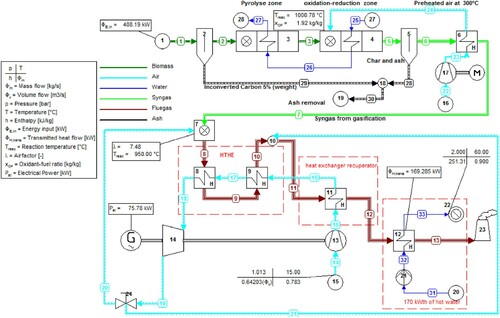
Table 3. Performance parameters of the EFGT system.
Table 4. Environment definition used in exergy calculations.
Table 5. OPEX and CAPEX economic values.
Table 6. Composition of the producer gas.
Figure 6. Composition of producer gas in function of air/fuel ratio. Olive pomace (a); olive tree pruning (b).
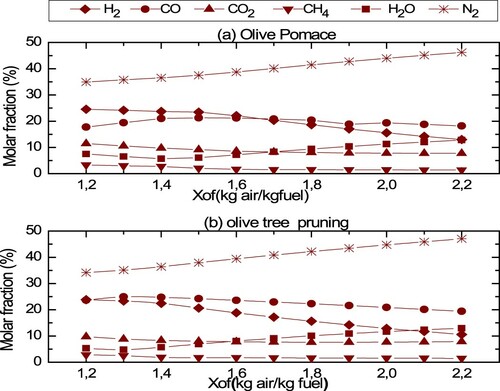
Figure 7. Effects of the OMSW moisture content on the syngas composition. Olive pomace (a); olive tree pruning (b).
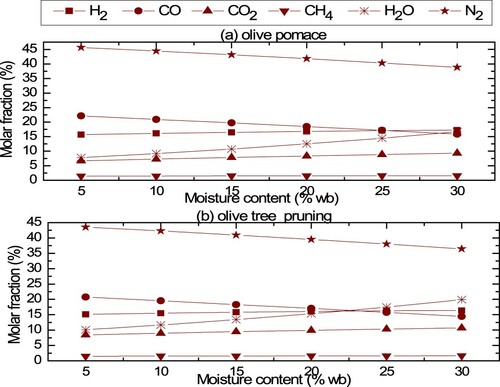
Figure 8. Effect of gasification temperature on low heating value.
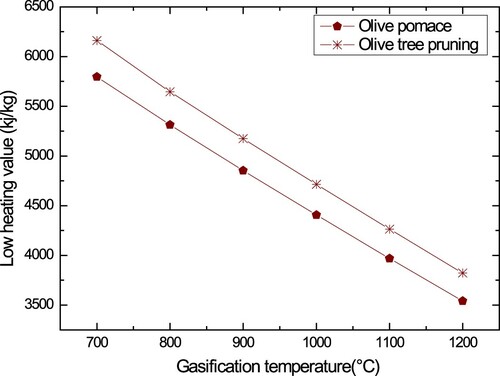
Figure 9. Effect of the gasification temperature over gasification efficiency.
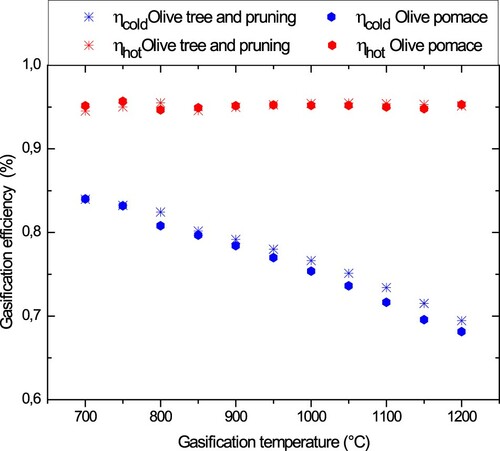
Figure 10. Electrical efficiency in function of pressure ratio.
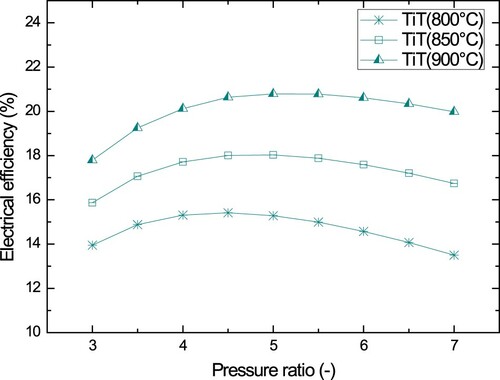
Figure 11. Effect of temperatures difference hot side on electrical efficiency.
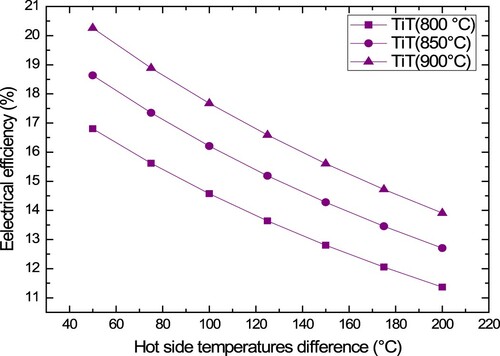
Figure 12. SANKEY diagram of the CHP plant.
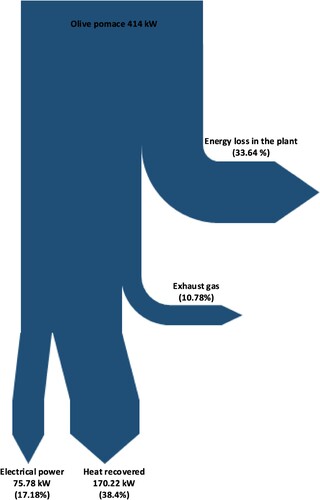
Figure 13. Energy losses in the main components of the plant.
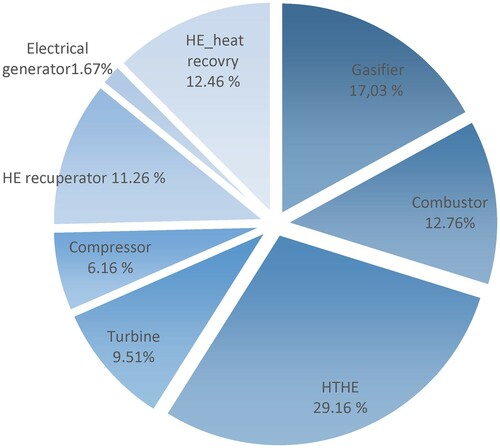
Table 7. CHP plant performances with optimum operating parameters.
Figure 14. Exergy distribution in the CHP plant.
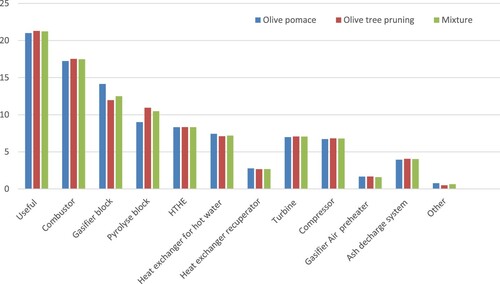
Table 8. Comparison between the biomass consumption of the plant and available feedstock.
Figure 15. NPV as function of biomass cost (K$).
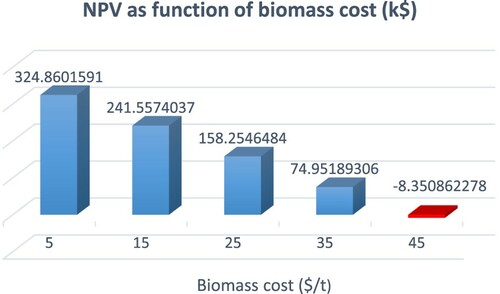
Figure 16 . IRR as function of biomass cost (%).
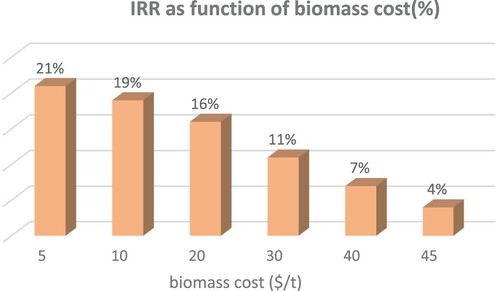
Table 9. Financial appraisal of the project.
Table 10. Potential of olive oil industry in the region of Tizi ouzou.
Table 11. Potential of electricity generated from olive solid wastes in the region of Tizi ouzou.