
Figures & data
Table 1 . Ten years (2005–2014) monthly average GHI, DNI and temperature (T) for Kolkata.
Figure 1. Monthly hourly average GHI in Kolkata.
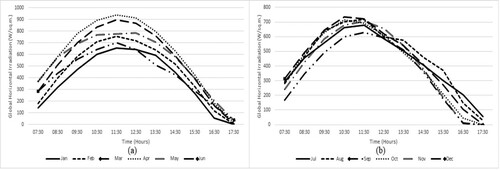
Figure 2. Monthly hourly average DHI in Kolkata.
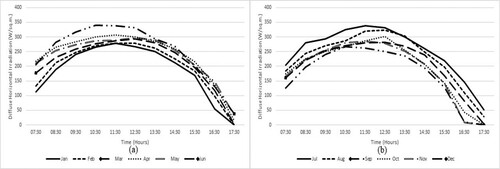
Figure 3. Monthly DHI to GHI ratio for Kolkata for the period of 2005–2015 .
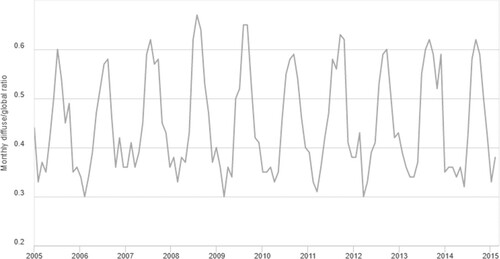
Table 2 . Global and diffuse luminous efficacy coefficients of Perez model.
Table 3 . Various IESNA recommended daylight availability constants.
Table 4 . Sky ratio ranges corresponding to different sky conditions.
Table 5 . Average global luminous efficacy (lm/W) in Kolkata.
Table 6. Average diffuse luminous efficacy (lm/W) in Kolkata.
Table 7. Average global horizontal illuminance (klx) in Kolkata.
Table 8. Average diffuse horizontal illuminance (klx) in Kolkata.
Table 9. Average direct horizontal solar illuminance (klx) in Kolkata.
Table 10. Average horizontal sky (diffuse) illuminance (klx) in Kolkata.
Table 11. Total average daylight illuminance (klx) in Kolkata.
Figure 4. Comparison of Measured Solar Illuminance Values with Computed Solar Illuminance Values for April Month.
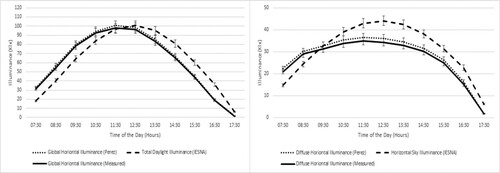
Figure 5. Estimation of daylight illuminance transmission into a room through an eastward window with motorised shading control with data obtained from Perez model.
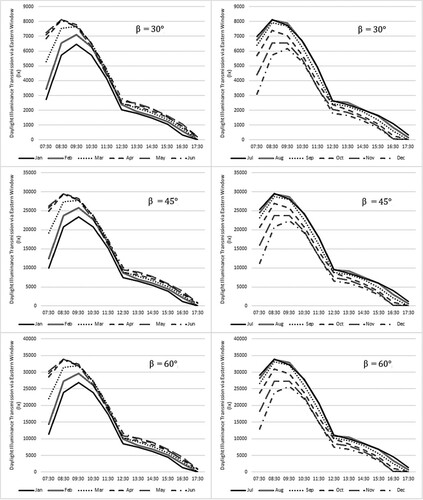
Figure 6. Estimation of daylight illuminance transmission into a room through an eastward window with motorised shading control with data obtained from IESNA recommended calculation procedure.
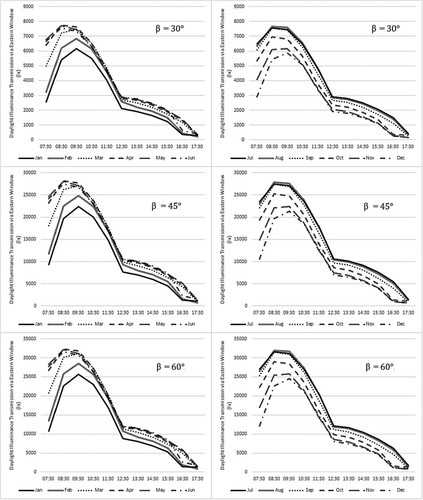
Figure 7. Estimation of average horizontal workplane illuminance from light pipe simulation with data obtained from Perez model.
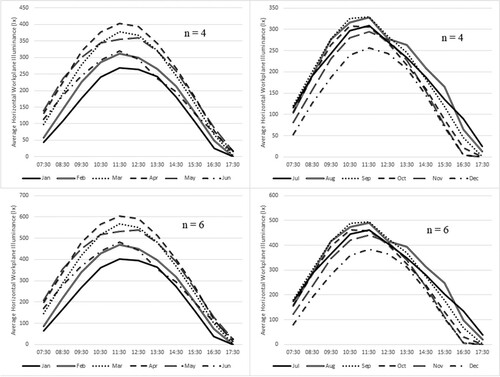
Figure 8. Estimation of average horizontal workplane illuminance from light pipe simulation with data obtained from IESNA recommended calculation procedure.
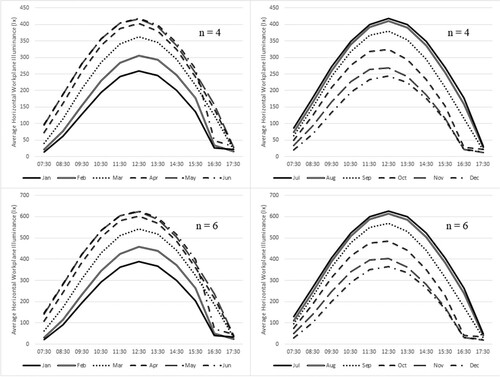
Figure 9. Estimation of average horizontal workplane illuminance from skylight simulation with data obtained from Perez model.
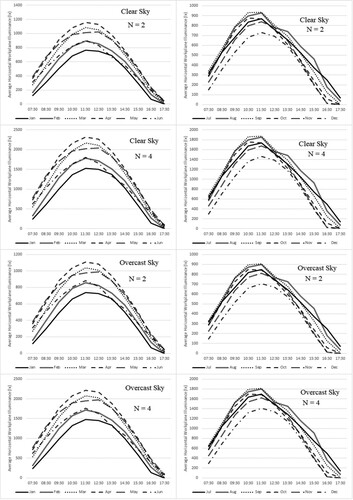
Figure 10. Estimation of average horizontal workplane illuminance from skylight simulation with data obtained from IESNA recommended calculation procedure.
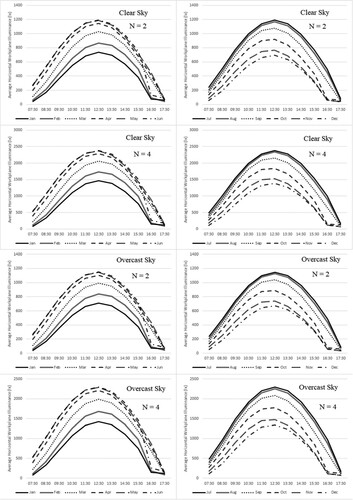
Figure 11. Estimation of daylight illuminance transmission into a room through a clerestory from light shelf simulation with data obtained from Perez model.
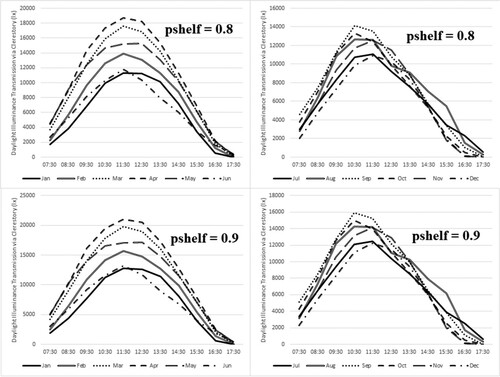
Figure 12. Estimation of daylight illuminance transmission into a room through a clerestory from light shelf simulation with data obtained from IESNA recommended calculation procedure.
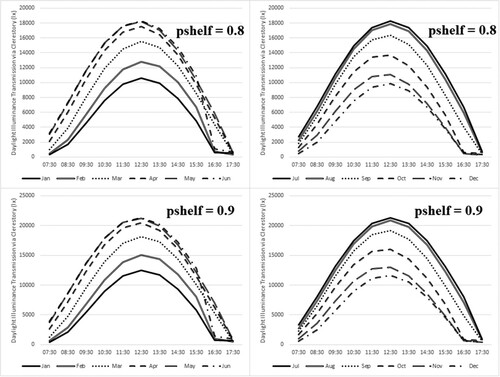
Figure 13. Percentage cumulative frequency curves of global and diffuse horizontal illuminance for applied Perez model.
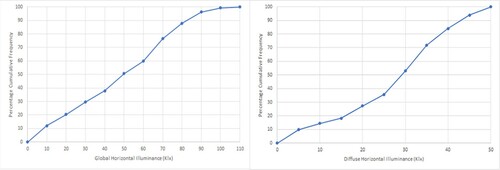
Figure 14. Percentage cumulative frequency curves of total daylight illuminance and horizontal sky illuminance for applied IESNA recommended calculation procedure.
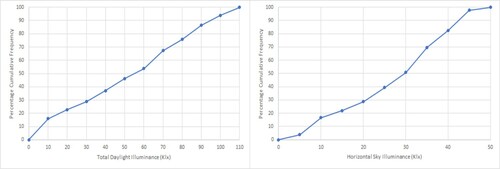
Figure 15. Percentage cumulative frequency curves of global and diffuse luminous efficacy for applied Perez model.
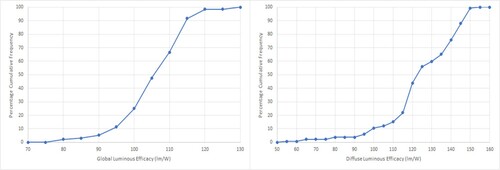
Figure 16. Plots of GHI vs. global horizontal illuminance and DHI vs. diffuse horizontal illuminance for the applied Perez model.
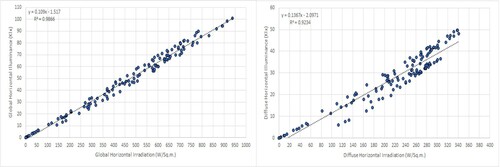
Figure 17. Plots of GHI vs. total daylight illuminance and DHI vs. horizontal sky illuminance for the applied IESNA recommended calculation procedure.
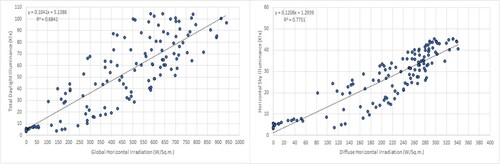
Table 12. Statistical Errors in the Estimation of Indoor Daylight Illuminance Levels.