
Figures & data
Figure 1. Typical modern design of a wind turbine gearbox (Onyx Insight Citation2019).
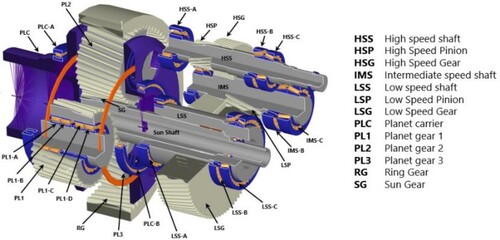
Figure 2. Simple representation of a BN.
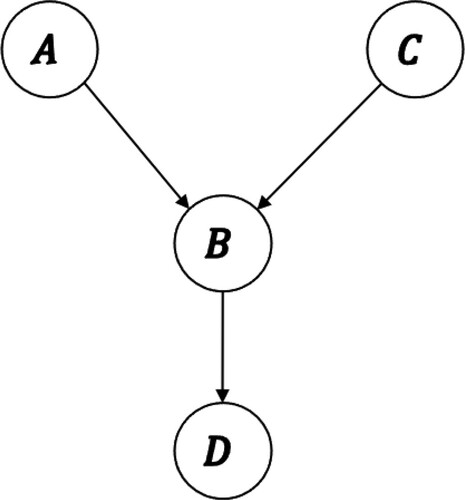
Figure 3. Typical structure of a DBN (Cai et al. Citation2013).
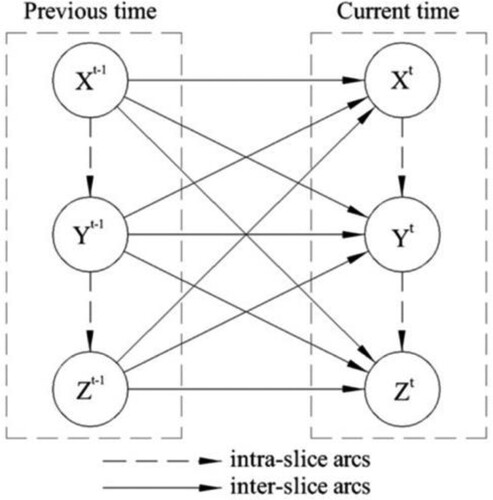
Table 1. Life data for gearbox subassemblies.
Figure 4. Unexpanded DBN model.
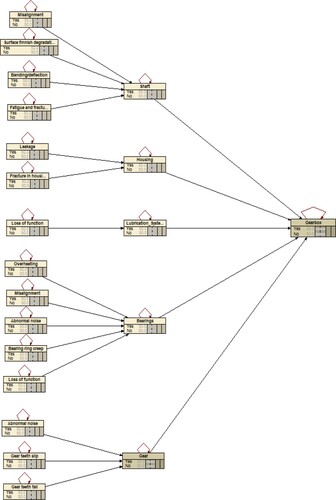
Table 2. CPT of gear subassembly performance.
Table 3. CPT of bearings subassembly performance.
Table 4. CPT of lubrication system performance.
Table 5. CPT of housing subassembly performance.
Table 6. CPT of shaft subassembly performance.
Figure 5. Reliability plot for gearbox over its lifetime.
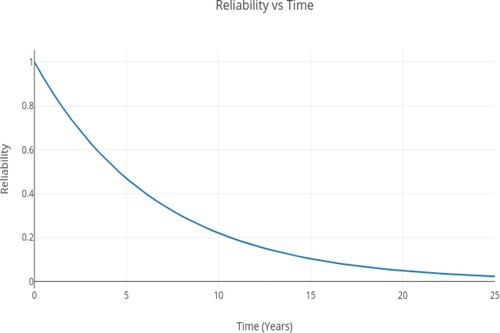
Figure 6. Reliability plot for gearbox subassemblies over its lifetime.
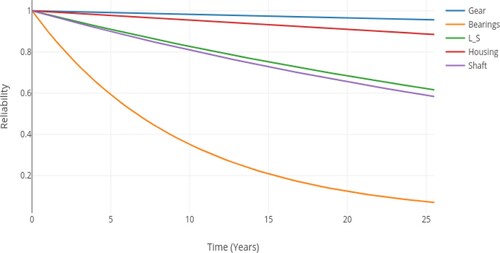
Figure 7. Mean availability for the gearbox over its lifetime.
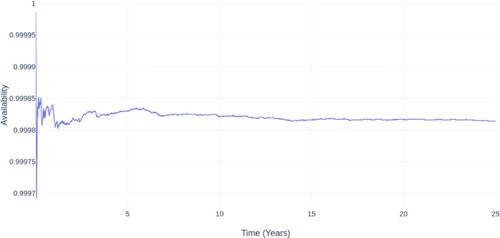
Figure 8. Backward (diagnostic) analysis of the wind turbine gearbox system.
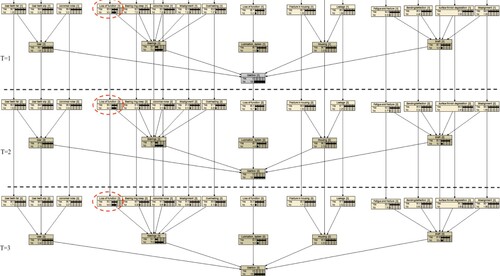
Table 7. Prior and posterior probabilities of all gearbox subsystems in each time slice.
Figure 9. Difference between prior and posterior probabilities.
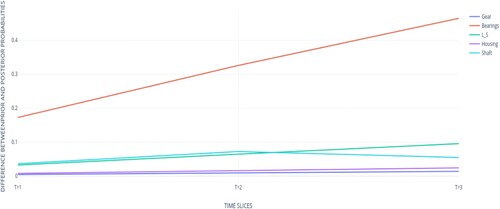
Figure 10. Failure criticality index for subassemblies of the wind turbine gearbox system.
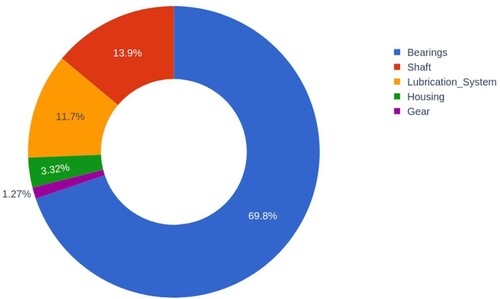
Figure 11. Gearbox system performance (a) without evidence of CBM (b) with evidence of CBM.
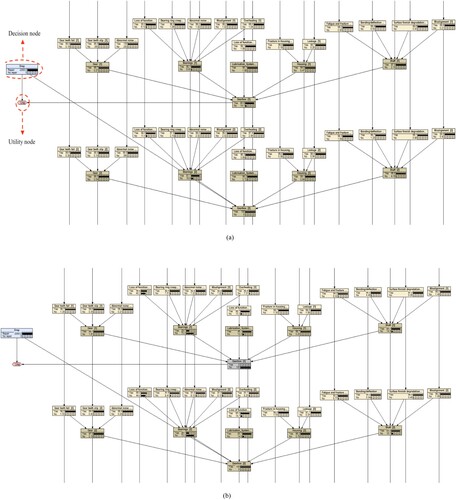
Figure 12. Effect of 100%, 80%, 60%, 40%, and 20% coverage factor on system reliability.
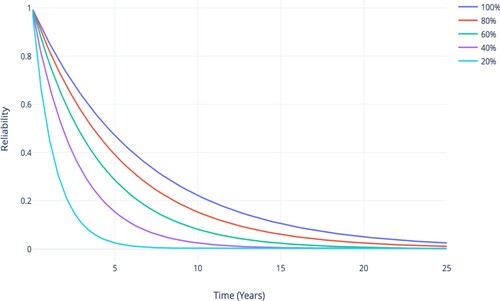
Table 8. Effect of coverage factor on the gearbox’s availability.
Table 9. Effect of coverage factor on the gearbox’s MTBF.
Table 10. Effect of coverage factor on average number of failures.