Figures & data
Figure 1. Schematic diagram of pyrolyser.
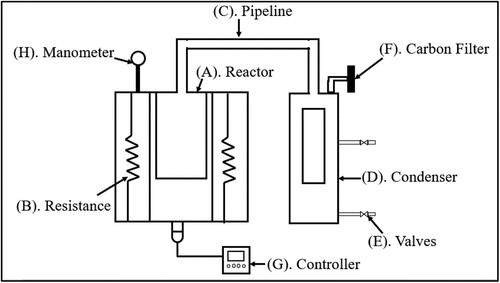
Table 1. Comparison of the component proximal analysis with previous studies (dry basis % by weight).
Table 2. Comparison of the elemental analysis with previous studies (dry basis % by weight).
Figure 2. (a) TG and (b) DTG thermograms of the biomass obtained from water hyacinth samples at different heating rates. (c) Thermal decomposition conversion profiles of water hyacinth biomass as a function of temperature for five heating rates and (d) temperature range selected for analysis.
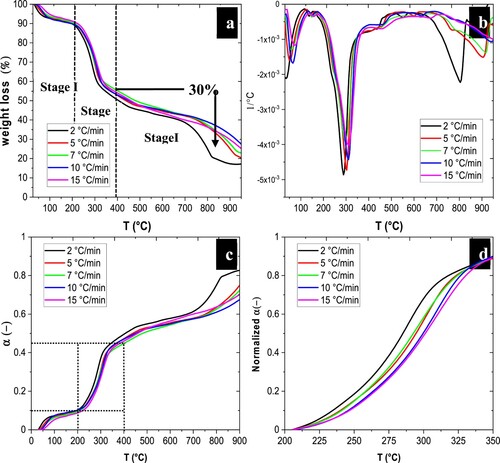
Table 3. Temperature range and weight loss for water hyacinth thermogravimetric stages. It: Initial temperature, Ft: Final temperature.
Figure 3. Application of the KAS (a), OFW (b), and Friedman (c) isoconversion methods to obtain the activation energy Ea.
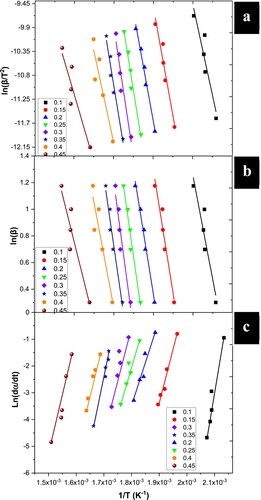
Table 4. Calculated temperature conversion for application of the isoconversional methods at different heating rates.
Figure 4. Activation energy as a function of conversion for the KAS and OFW models.
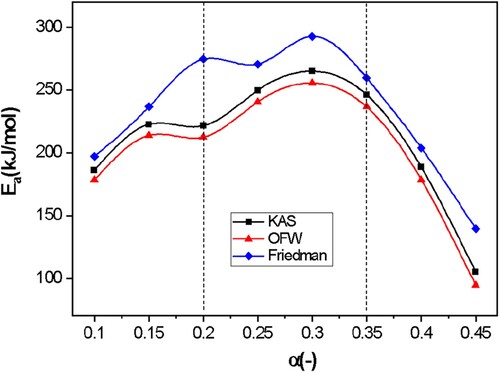
Table 5. Means of parameters calculated for each isoconversional method studied throughout the pyrolysis process.
Table 6. Comparison of water hyacinth from the present work with other biomass types.
Table 7. Pyrolysis performance, P-value of ANOVA statistical analysis and higher heating value of bio-oil for each of the tests.
Figure 5. FTIR spectrum of the water hyacinth bio-oil.
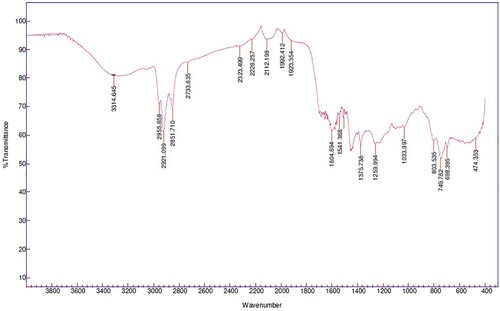
Table 8. Leading bands found in the typical infrared spectrum for bio-oil components.
Figure 6. Typical chromatogram of water hyacinth bio-oil.
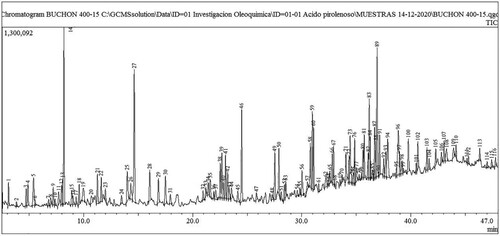
Figure 7. Mass spectrum of toluene.
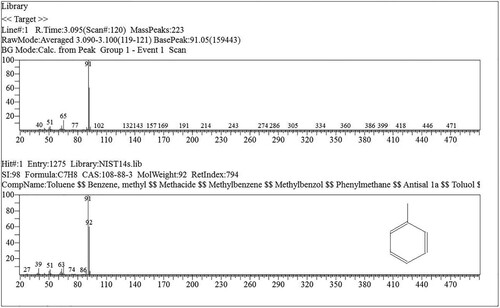
Table 9. Chemical compounds found in the water hyacinth bio-oil classified into its main families of functional groups (aromatics, hydrocarbons, alcohols and acids).
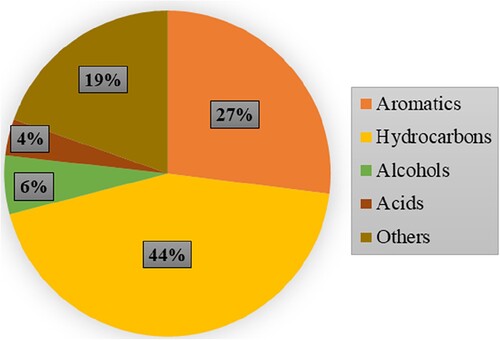
Figure 8. Total percentage of the main functional groups from water hyacinth pyrolysis bio-oil.