
Figures & data
Figure 1. Transition in electric power grid. (a) Traditional power grid system. (b) Smart grid system.
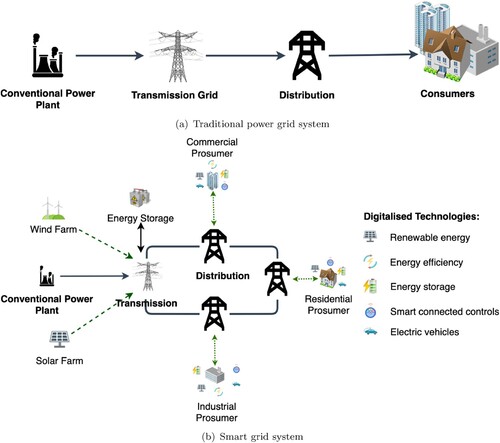
Figure 2. Blockchain overview.
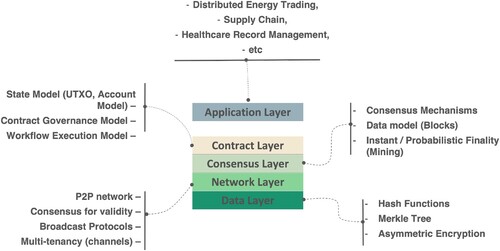
Figure 3. Blockchain data structure (chain of blocks).
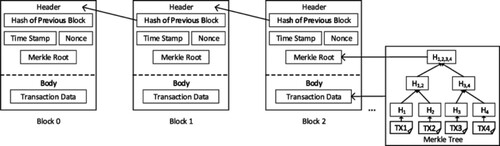
Figure 4. Network models.
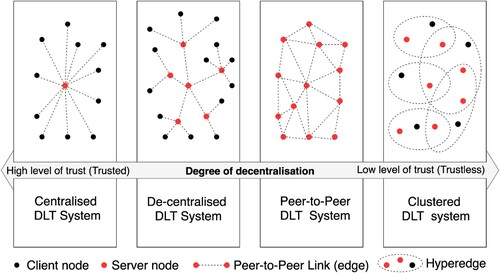
Figure 5. Possible pathways for electricity system transitions in Australia.
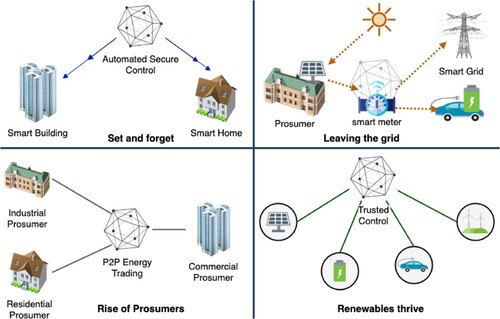
Figure 6. Energy consumption in megawatts at a different time of the day illustrates ‘The Duck curve problem’. Source: (Green, Martin, and Cojocar Citation2018).
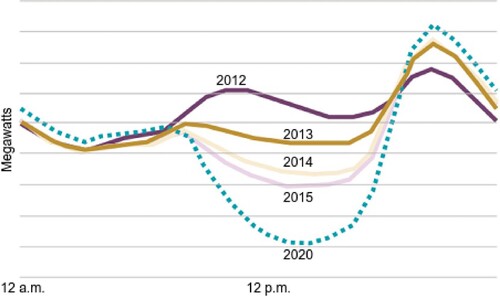
Figure 7. DSM activities.
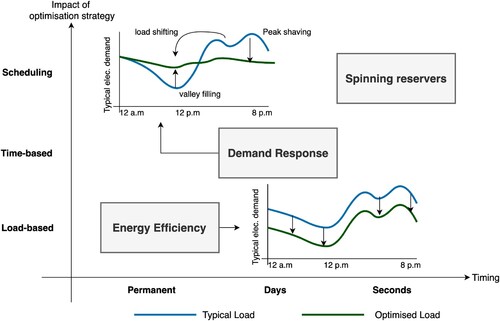
Table 1. A summary of the reviewed blockchain-based DET reviews.
Figure 8. The systematic mapping process.
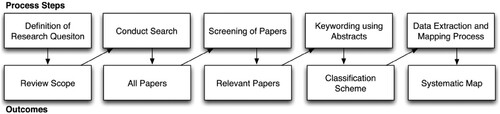
Table 2. Minimal requirements for each blockchain role.
Figure 9. Screening process.
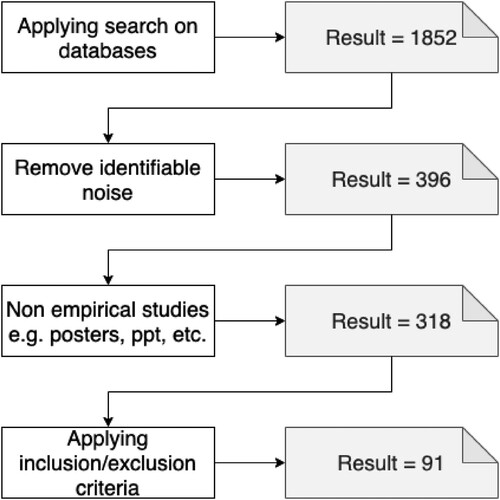
Figure 10. Classification scheme.
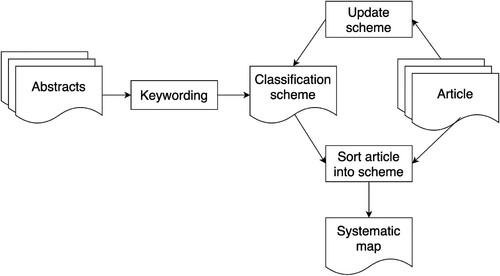
Table 3. Data extraction and synthesis template.
Figure 11. Components of a DET conceptual framework.
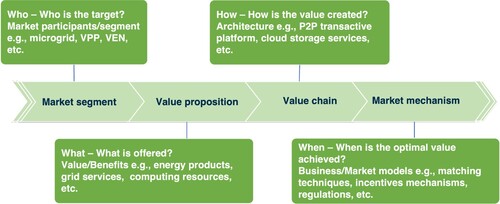
Figure 12. Energy trading value chains. (a) Traditional Centralised Energy Trading system. (b) Decentralised Energy Trading systems.
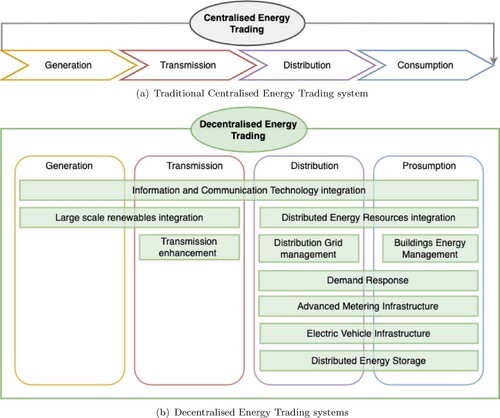
Table 4. Summary of the three market models.
Table 5. Technical barriers to blockchain-based DET and the currently proposed solutions.
Table 6. A summary of administrative, standardisation and economic barriers to blockchain-based DET and the currently proposed solutions.
Figure 13. BDET system attack taxonomy.
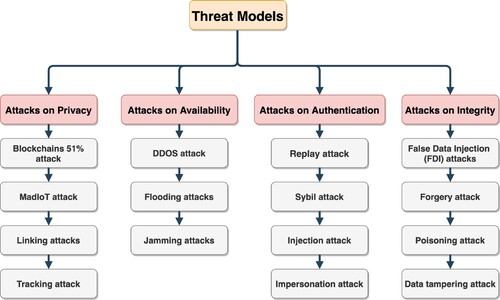
Figure 14. High-level consumer-retailer workflow for an Australian energy market.
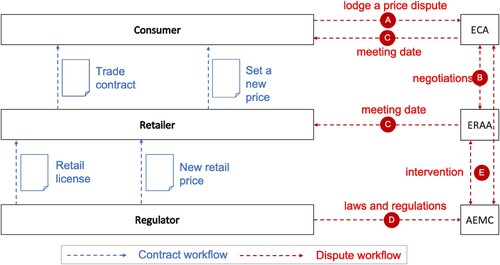
Table 7. Consumer-retailer trade contract.