Figures & data
Table 1. Different HRES configurations to meet drinking water demand with ROD system.
Figure 1. RO desalination process with RE-based hybrid system.
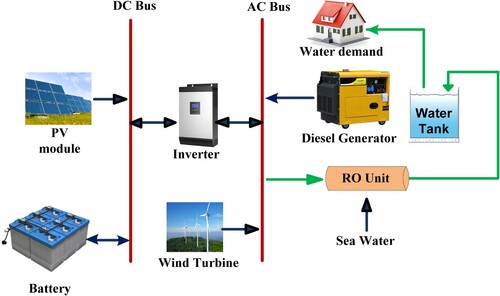
Table 2. Technical information of the proposed HES components.
Table 3. Financial information of the proposed HES components.
Figure 2. EMS for the RO desalination process with the HES.
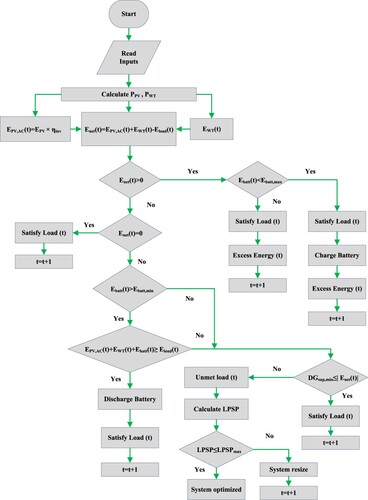
Table 4. CO2 life cycle equivalent emission for HES desalination process.
Figure 3. Flow chart of SSA-optimisation algorithm.
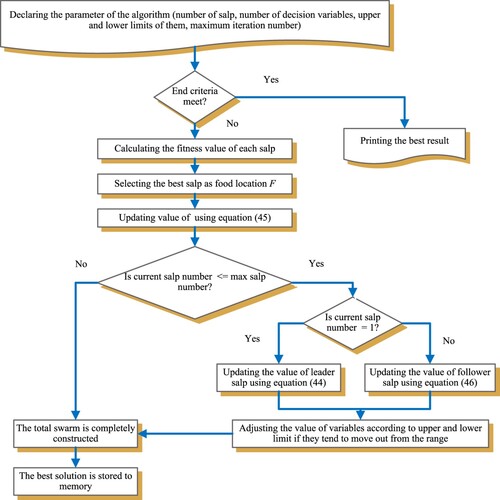
Figure 4. Flow chart of NSGA-II optimisation technique.
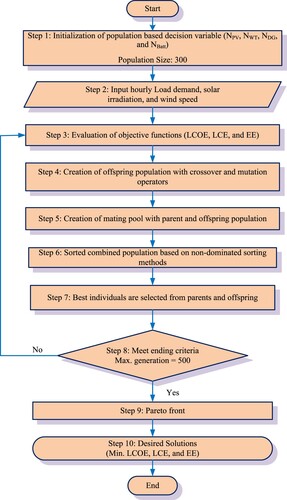
Figure 5. Flow chart of PSO optimisation algorithm.
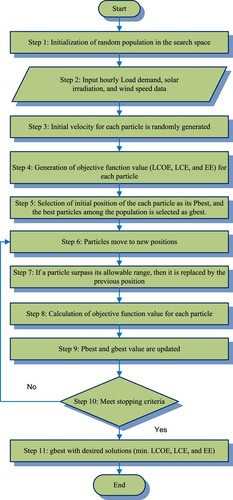
Figure 6. Location map of the study area.
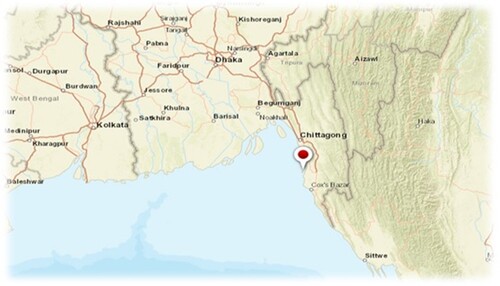
Figure 7. Hourly solar irradiation and wind velocity data of the study area.
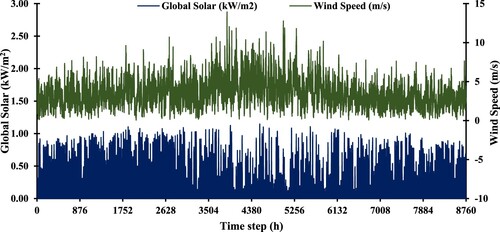
Figure 8. Frequency distribution of solar irradiation for the study area.
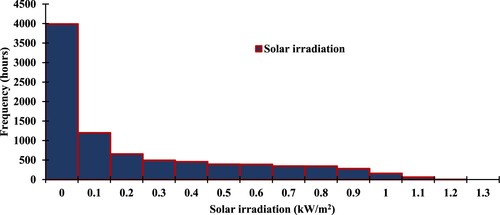
Figure 9. Frequency distribution of wind velocity for the study area.
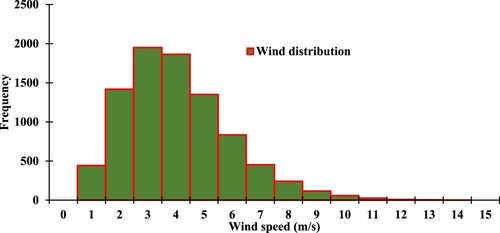
Figure 10. Hourly load demand for a day.
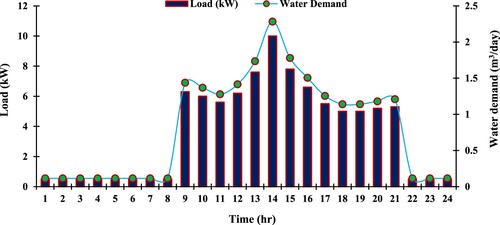
Table 5. Optimised results of the RO desalination HES.
Figure 11. Comparison between LCOE and COW for different hybridised scenarios.
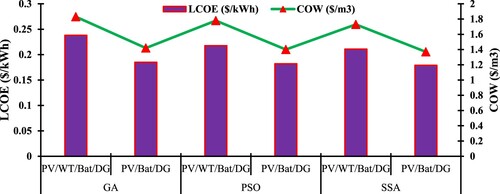
Figure 12. Break down of the total NPC for different optimised systems.
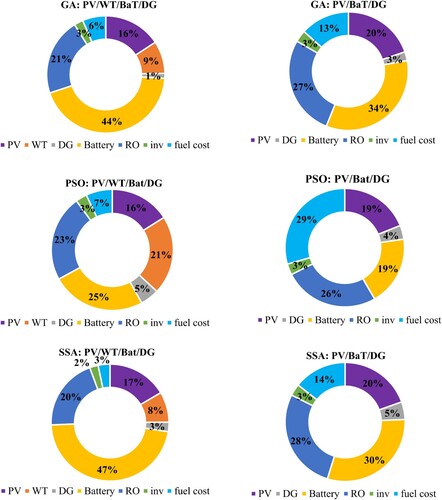
Figure 13. Optimal system sizing summary of PV/WT/Bat/DG-based HES configuration using SSA algorithm.
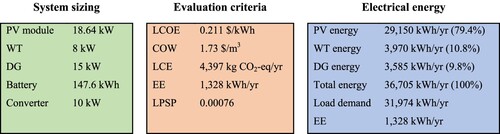
Figure 14. Optimal system sizing summary of PV/Bat/DG-based HES configuration using SSA algorithm.
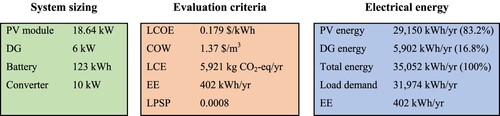
Figure 15. Cost breakdown for the various optimised configurations.
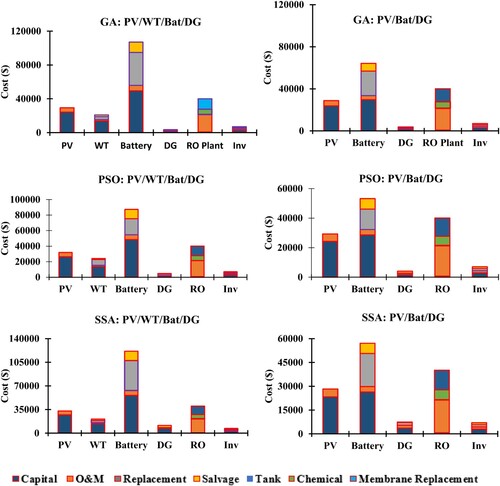
Figure 16. Annual energy production from various HES components and the generated EE.
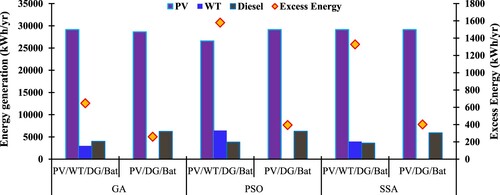
Figure 17. Time series data for power mix of PV/Bat/DG system with SSA algorithm.
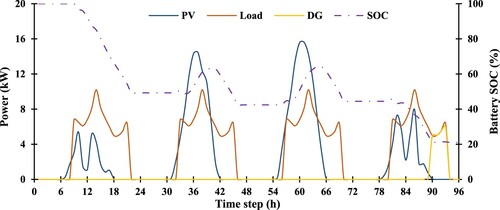
Figure 18. Illustration of annual life cycle emission (LCE) and renewable fraction.
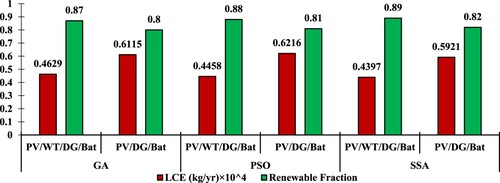
Table 6. Comparison of optimised PV/Bat/DG with diesel-only system using SSA algorithm.
Figure 19. Effects of daily freshwater demand on COW for PV/WT/Bat/DG hybrid system.
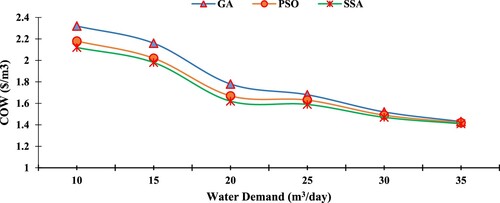
Figure 20. Effects of daily freshwater demand on COW for PV/Bat/DG hybrid system.
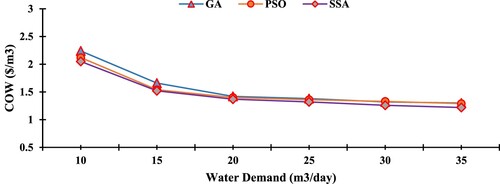
Figure 21. Variation of component sizing with LPSP for PV/Bat/DG configuration with SSA algorithm.
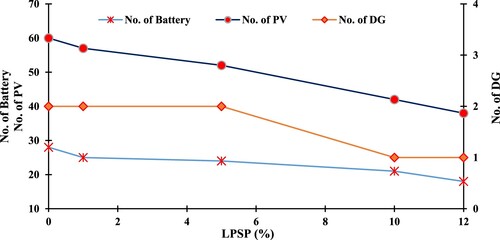
Figure 22. Effects of LPSP on LCOE and NPC for PV/Bat/DG configuration with SSA algorithm.
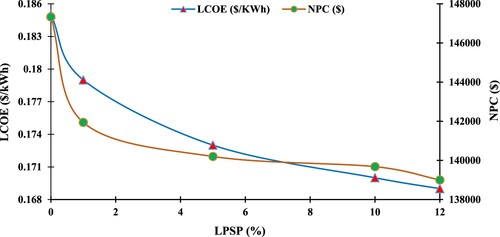
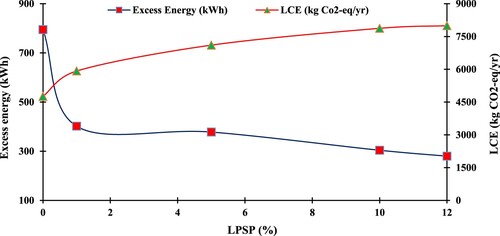
Figure 23. Effects of LPSP on EE and LCE for PV/Bat/DG configuration with SSA algorithm.